Crash dumps are very useful for debugging applications. Recently, I worked on a Visual Studio extension used in my company. While developing such an extension is straightforward, there are many reasons it might crash. You can add try/catch blocks everywhere, but it is easy to miss the right one and let Visual Studio crash. When that happens, you want to attach a debugger and inspect the exception and stack trace. A better approach is to automatically generate a crash dump that you can analyze later.
On Windows, you can configure Windows Error Reporting (WER) to generate a dump when an application crashes.
- Open
regedit.exe - Open the key
HKEY_LOCAL_MACHINE\SOFTWARE\Microsoft\Windows\Windows Error Reporting\LocalDumps - Set the value
DumpFolder (REG_EXPAND_SZ) to the directory you want the dump to be created - Optionally, you can prevent WER from keeping too many crash dumps by setting
DumpCount (DWORD) to a low number
Maybe you prefer to set the configuration using PowerShell:
PowerShell
New-Item -Path "HKLM:\SOFTWARE\Microsoft\Windows\Windows Error Reporting" -Name "LocalDumps"
New-ItemProperty -Path "HKLM:\SOFTWARE\Microsoft\Windows\Windows Error Reporting\LocalDumps" -Name "DumpFolder" -Value "%LOCALAPPDATA%\CrashDumps" -PropertyType ExpandString
New-ItemProperty -Path "HKLM:\SOFTWARE\Microsoft\Windows\Windows Error Reporting\LocalDumps" -Name "DumpCount" -Value 10 -PropertyType DWord
You can also configure WER per application. If you want to generate a full dump only for a specific application, create a key under LocalDumps named after the executable. For example, if your application is devenv.exe, the key name is devenv.exe.
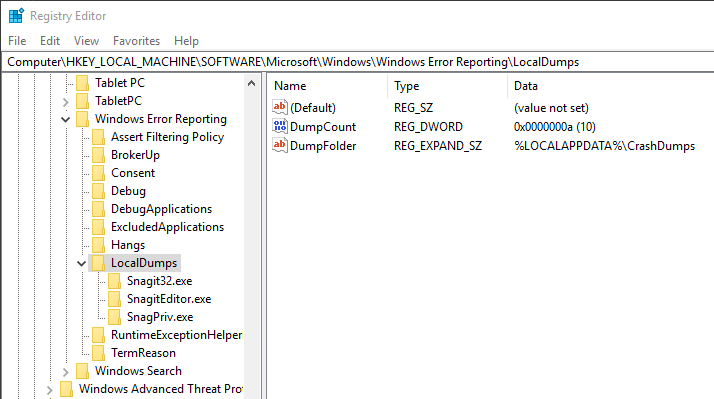 Windows Error Reporting (WER) configuration
When your application crashes, you can go to %LOCALAPPDATA%\CrashDumps:
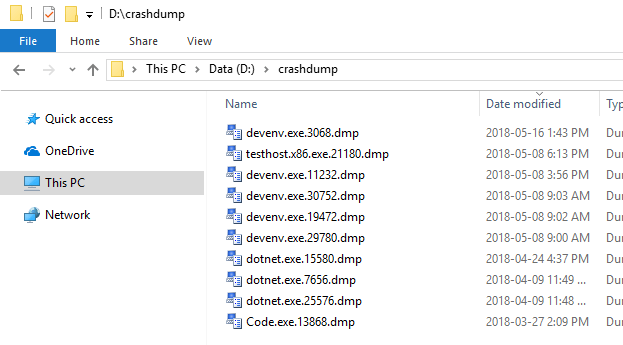 Windows Error Reporting (WER) generated crash dump
Find the latest dump and open it in Visual Studio to start debugging. By default, Visual Studio shows system information, the exception that caused the crash, and the list of loaded modules. Use the action panel on the right to start the debugger and investigate the exception further.
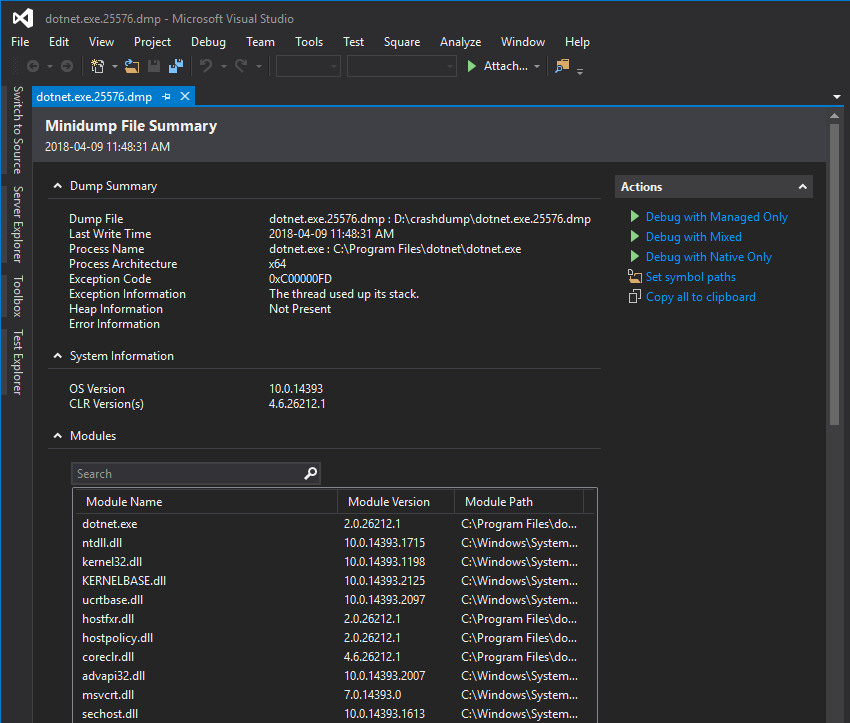 Debug crash dump in Visual Studio
#Additional resources
Do you have a question or a suggestion about this post? Contact me!