Automated tests are essential to ensure your application behaves correctly. The more tests you write, the more use cases are covered. However, it can be hard to know which parts of the application are well-tested and which are not. That is where code coverage helps. It is a useful measure for identifying potential risk areas, such as complex methods with little test coverage. Let's see how to set this up easily with .NET Core and Azure DevOps.
To compute code coverage when running tests, there are multiple tools available. Some are free, such as coverlet, and some are paid, such as dotCover. In this post, I'll use coverlet. To get started, install the NuGet package coverlet.msbuild, which integrates directly with dotnet test.
csproj (MSBuild project file)
<Project Sdk="Microsoft.NET.Sdk">

  ...

  <ItemGroup>
    <PackageReference Include="coverlet.msbuild" Version="2.5.1">
      <PrivateAssets>all</PrivateAssets>
      <IncludeAssets>runtime; build; native; contentfiles; analyzers</IncludeAssets>
    </PackageReference>
  </ItemGroup>

  ...

</Project>
You can verify everything works by running dotnet test /p:CollectCoverage=true. After the test run, a JSON file is created next to the .csproj file. Azure DevOps does not support this format, but coverlet can output results in many standard formats. Use the cobertura format, which Azure DevOps supports.
Shell
dotnet test /p:CollectCoverage=true /p:CoverletOutputFormat=cobertura
After running the command for each test project, you get one coverage file per project. These files are not easy to read directly. To generate a readable report, use ReportGenerator, a free tool that produces a website showing which lines are covered by tests. Install it as a .NET global tool:
Shell
dotnet tool install -g dotnet-reportgenerator-globaltool
reportgenerator -reports:tests/**/coverage.cobertura.xml -targetdir:Report -reporttypes:HtmlInline_AzurePipelines;Cobertura
You now have a website displaying the code coverage results. There are multiple output formats available. Here, HtmlInline_AzurePipelines is used because it is optimized for viewing directly in Azure Pipelines.
Now let's integrate tests and code coverage into the build pipeline. Below is the YAML file describing the build steps:
YAML
variables:
  buildConfiguration: Release
  DOTNET_SKIP_FIRST_TIME_EXPERIENCE: 1

steps:
# Install the latest version of the dotnet sdk
- task: DotNetCoreInstaller@0
  displayName: 'Use .NET Core sdk 2.2.103'
  inputs:
    version: 2.2.103

# build all projects
- task: DotNetCoreCLI@2
  displayName: dotnet build
  inputs:
    projects: 'src/**/*.csproj'
    arguments: '--configuration $(BuildConfiguration)'

# Run all tests with "/p:CollectCoverage=true /p:CoverletOutputFormat=cobertura" to generate the code coverage file
- task: DotNetCoreCLI@2
  displayName: dotnet test
  inputs:
    command: test
    arguments: '--configuration $(BuildConfiguration) /p:CollectCoverage=true /p:CoverletOutputFormat=cobertura'
    projects: 'tests/**/*.csproj'
    nobuild: true

# Generate the report using ReportGenerator (https://github.com/danielpalme/ReportGenerator)
# First install the tool on the machine, then run it
- script: |
    dotnet tool install -g dotnet-reportgenerator-globaltool
    reportgenerator -reports:$(Build.SourcesDirectory)/tests/**/coverage.cobertura.xml -targetdir:$(Build.SourcesDirectory)/CodeCoverage -reporttypes:HtmlInline_AzurePipelines;Cobertura
  displayName: Create Code coverage report

# Publish the code coverage result (summary and web site)
# The summary allows to view the coverage percentage in the summary tab
# The web site allows to view which lines are covered directly in Azure Pipeline
- task: PublishCodeCoverageResults@1
  displayName: 'Publish code coverage'
  inputs:
    codeCoverageTool: Cobertura
    summaryFileLocation: '$(Build.SourcesDirectory)/CodeCoverage/Cobertura.xml'
    reportDirectory: '$(Build.SourcesDirectory)/CodeCoverage'
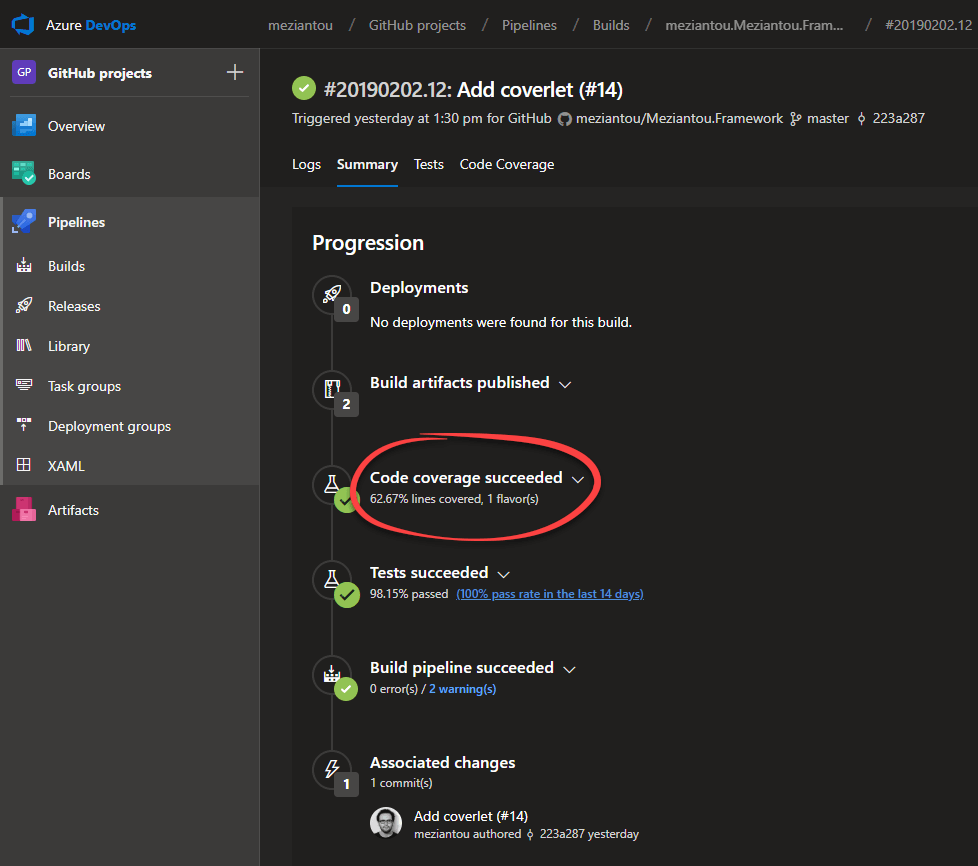
After running a build, the code coverage result appears in the Summary tab:
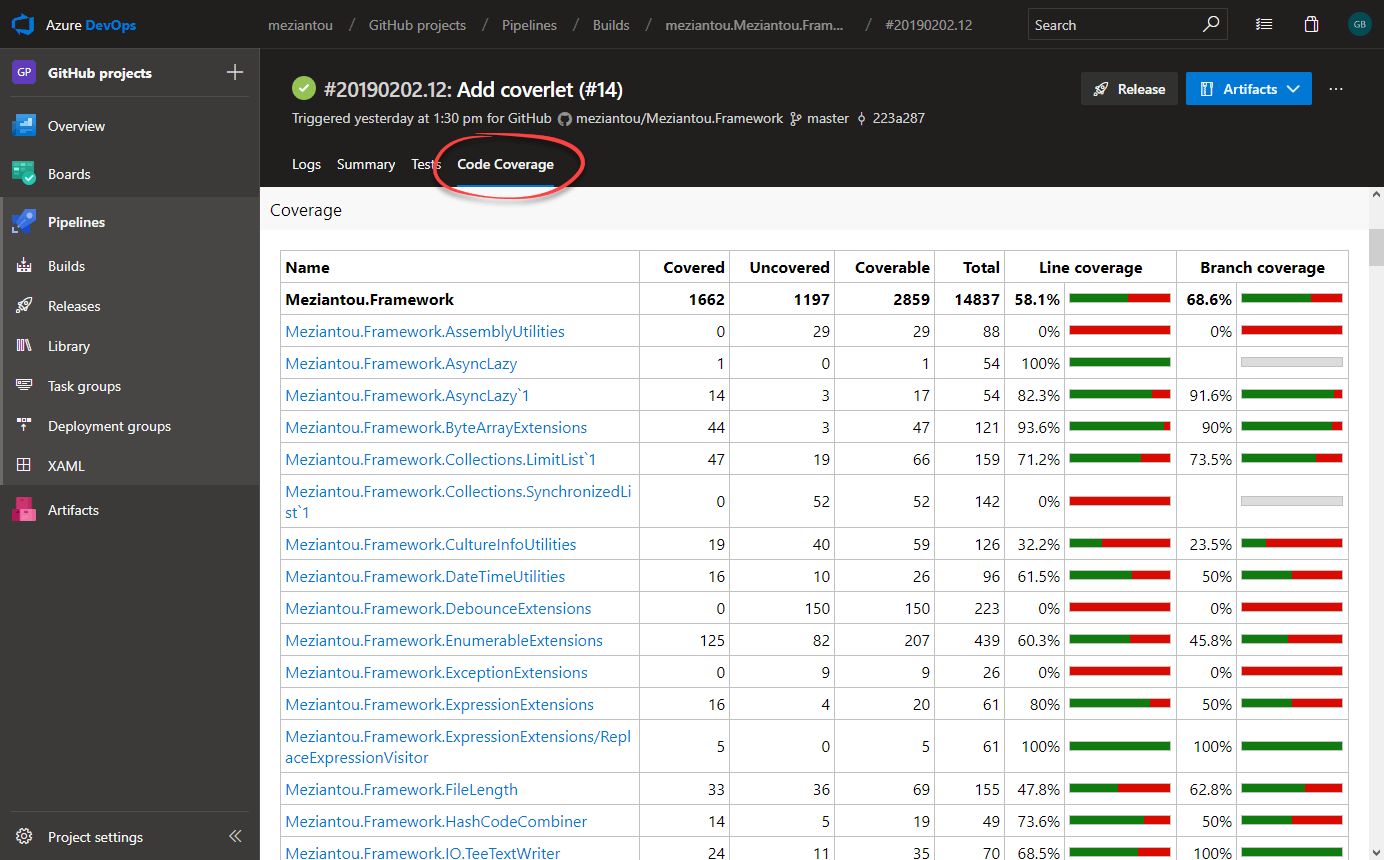
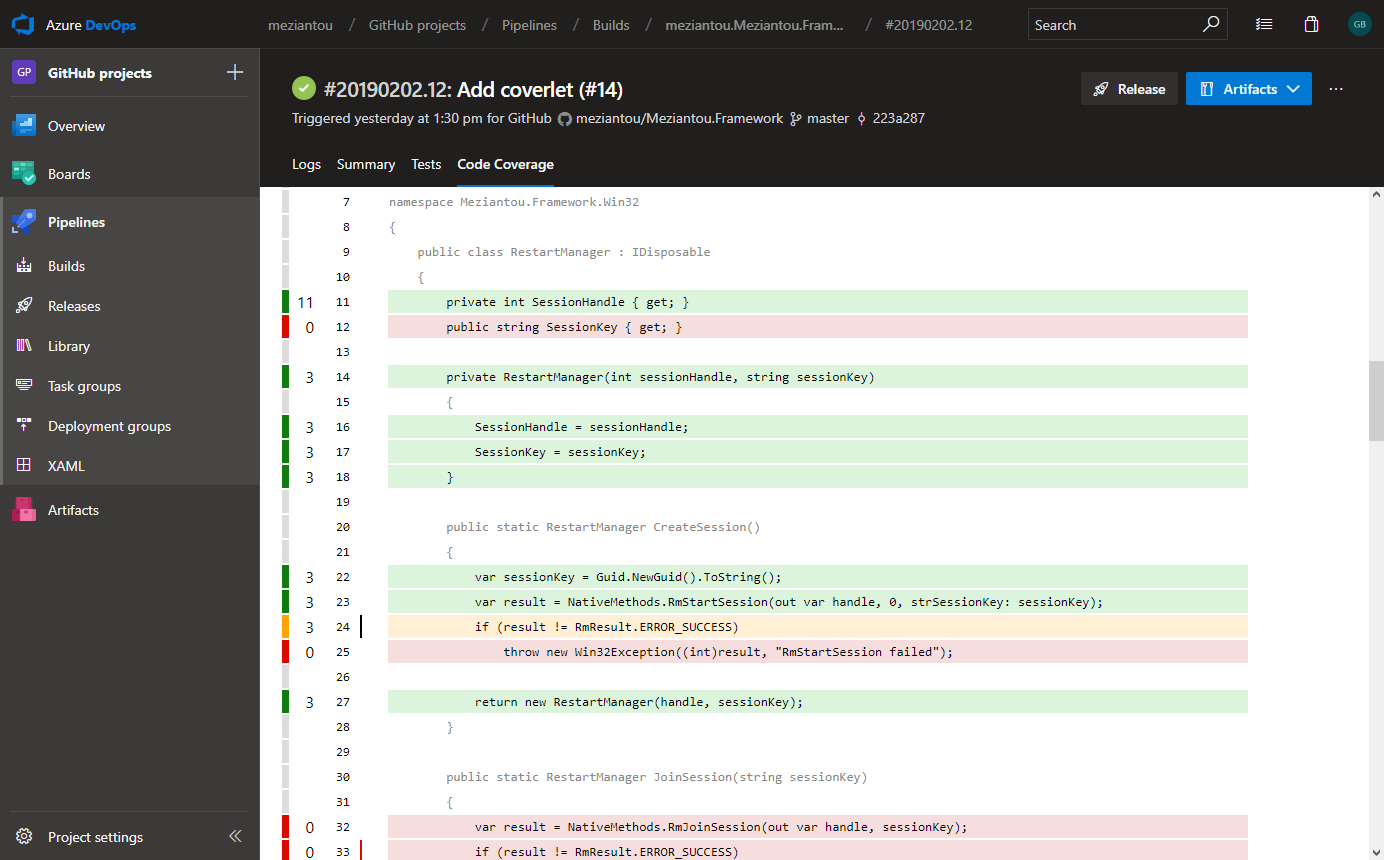
A "Code Coverage" tab is also available. Clicking it opens the generated website.
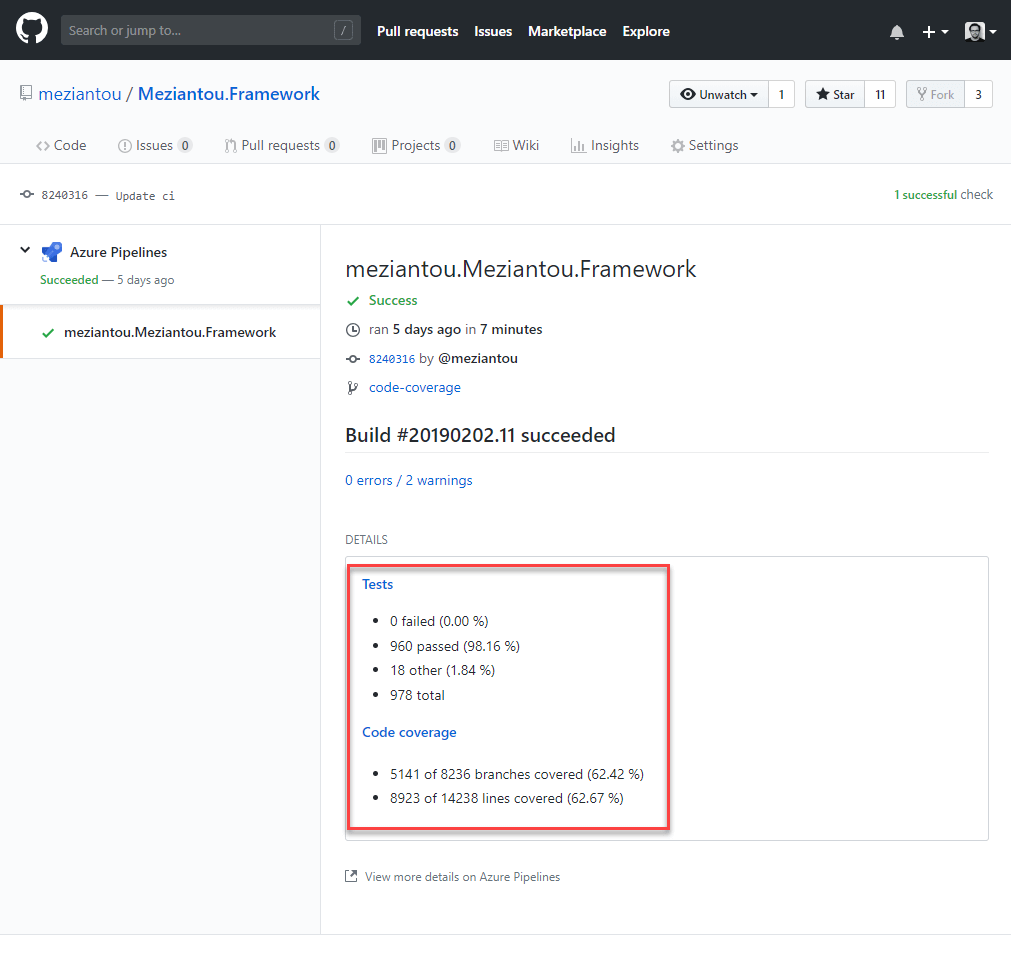
For a real-world example, see my GitHub project Meziantou.Framework and its pipeline with coverlet integrated. The coverage result is also reported back to GitHub:
With coverlet and ReportGenerator, you can quickly identify which parts of your application need more test coverage.
Do you have a question or a suggestion about this post? Contact me!