When using an external closed-source library, it can be useful to understand how it works internally. Several .NET decompilers are available: Reflector, DotPeek, JustDecompile, and ILSpy. These tools let you decompile a .NET DLL or EXE to inspect its logic. That works well for static analysis, but sometimes you need to go further and observe how the code behaves at runtime.
To show the source code of a DLL, Visual Studio relies on PDB files (symbol files) to link compiled code back to source. These files can be loaded from the local disk or from a symbol server. The challenge with third-party DLLs is that neither the source code nor the PDB files are available. This is where DotPeek comes in: it acts as a symbol server, decompiles DLLs on the fly, and generates PDB files on demand. Visual Studio can then display the decompiled source code.
#DotPeek installation
Download and install DotPeek: https://www.jetbrains.com/decompiler
Start the symbol server
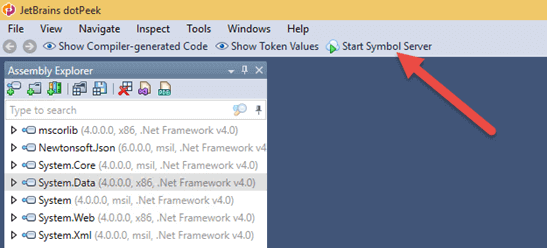
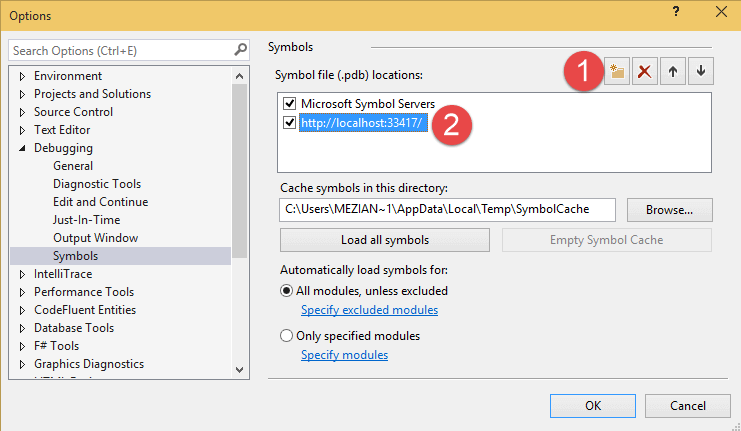
Configure Visual Studio to use this server (the full URL is available in the DotPeek Options window):
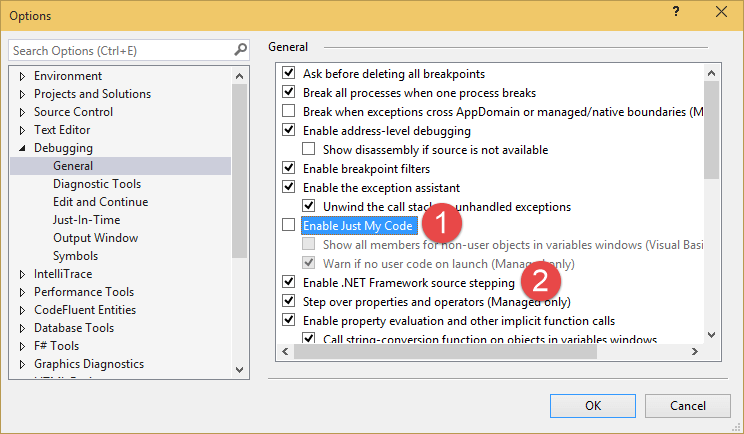
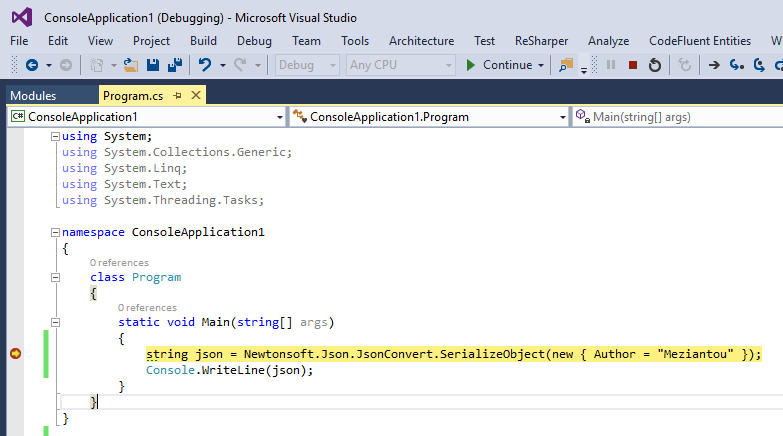
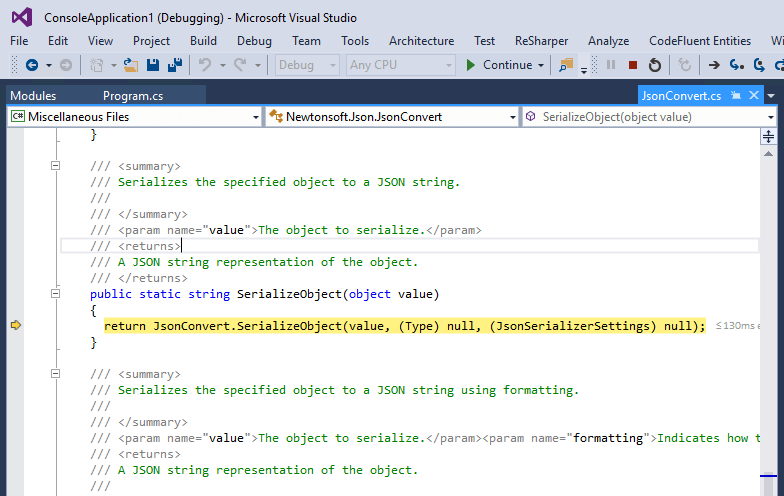
With DotPeek configured, you can freely use F11 in Visual Studio to step into decompiled code:
#Troubleshooting
If you run into issues, check the following points:
Open the "Project / PDB Generation Log" window in DotPeek. All symbol requests are displayed there. If the assembly is not listed, check the following point.
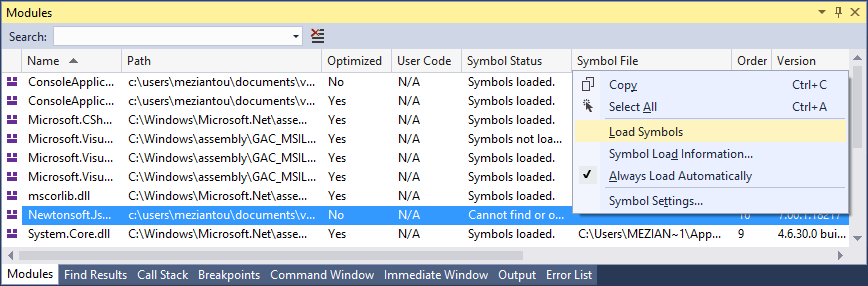
In Visual Studio, open the Debug / Windows / Module window and verify that the symbols are loaded for the desired assembly. If this is not the case, force the loading of these:
Do you have a question or a suggestion about this post? Contact me!