In a previous post, I explained how to monitor a .NET application using OpenTelemetry. The telemetry data includes traces, metrics, and logs. When using OpenTelemetry, the application publishes the data to the OpenTelemetry Collector or exposes endpoints to get the data. However, .NET provides a way to get the data from outside the application using ETW or the diagnostics event pipe. In this post, I explain how to get logs, traces, and metrics using dotnet trace, the Diagnostic Event Pipe, or a custom ETW session.
#Demo application
The sample application creates activities, logs, and metrics every second.
Shell
dotnet new console -o SampleApp
cd SampleApp
dotnet add package Microsoft.Extensions.Logging.EventSource
Program.cs (C#)
using System.Diagnostics;
using System.Diagnostics.Metrics;
using Microsoft.Extensions.DependencyInjection;
using Microsoft.Extensions.Logging;

// Create logger
var serviceCollection = new ServiceCollection();
serviceCollection.AddLogging(builder =>
{
    builder.AddEventSourceLogger(); // This is added automatically in the default ASP.NET Core template
});
var services = serviceCollection.BuildServiceProvider();
var logger = services.GetRequiredService<ILogger<Program>>();

// Create ActivitySource
var activitySource = new ActivitySource("SampleActivitySource");

// Create Meters
var meter = new Meter("SampleMeter");
var counter = meter.CreateCounter<int>("SampleCounter");

// Send telemetry events
while (true)
{
    // Start activity
    using (var activity = activitySource.StartActivity("test"))
    {
        activity?.AddTag("mykey", "myvalue");

        // Log data
        logger.LogInformation("New value {Value}", Random.Shared.Next(1, 10));

        // Increase counter
        counter.Add(Random.Shared.Next(1, 10));
        using (activitySource.StartActivity("other activity"))
        {
            await Task.Delay(1000);
        }
    }
}
You can now run the application using
Shell
dotnet run
You can keep the application running while testing the different method to gather telemetry data.
#Accessing telemetry data from inside the application
##MeterListener
You can listen to the metrics instrument measurements recording using MeterListener. You need to subscrive to new instrument measurements using MeterListener.Subscribe before getting data.
C#
var meterListener = new MeterListener();

// Subscribe to an instrument
var meterListener = new MeterListener();
meterListener.InstrumentPublished = (instrument, meterListener) =>
{
    Console.WriteLine($"Subscribing to {instrument.Meter.Name}\\{instrument.Name}");
    meterListener.EnableMeasurementEvents(instrument);
};

// You need one callback per measure type
meterListener.SetMeasurementEventCallback<int>((Instrument instrument, int measurement, ReadOnlySpan<KeyValuePair<string, object?>> tags, object? state) =>
{
    Console.WriteLine($"{instrument.Meter.Name}\\{instrument.Name}:{measurement}");
});

meterListener.SetMeasurementEventCallback<long>((Instrument instrument, long measurement, ReadOnlySpan<KeyValuePair<string, object?>> tags, object? state) =>
{
    Console.WriteLine($"{instrument.Meter.Name}\\{instrument.Name}:{measurement}");
});

// Start listening to meter events
meterListener.Start();
##ActivityListener
The ActivityListener class allows listening to the start and stop activity events and gives the opportunity to decide creating an activity for sampling scenarios. When there is no listener ActivitySource.StartActivity returns null.
C#
var activityListener = new ActivityListener();
activityListener.ShouldListenTo =
    activitySource => activitySource.Name == "SampleActivitySource";

activityListener.ActivityStarted = ActivityStarted;
activityListener.ActivityStopped = ActivityStopped;
activityListener.Sample = Sample;

ActivitySource.AddActivityListener(activityListener);

void ActivityStarted(Activity activity)
{
    Console.WriteLine("ActivityStarted:" + activity.DisplayName);
}

void ActivityStopped(Activity activity)
{
    Console.WriteLine("ActivityStopped:" + activity.DisplayName);
}

ActivitySamplingResult Sample(ref ActivityCreationOptions<ActivityContext> context)
{
    return ActivitySamplingResult.AllData;
}
##ILoggerProvider / ILogger
To gather logs, you can create your own Logger/LoggerProvider and register them to the logger factory:
C#
class CustomLoggerProvider : ILoggerProvider
{
    private readonly LoggerExternalScopeProvider _scopeProvider = new();

    public ILogger CreateLogger(string categoryName)
        => new CustomLogger(categoryName, _scopeProvider);

    public void Dispose() { }
}

class CustomLogger : ILogger
{
    private string _categoryName;
    private LoggerExternalScopeProvider _scopeProvider;

    public CustomLogger(string categoryName, LoggerExternalScopeProvider scopeProvider)
    {
        _categoryName = categoryName;
        _scopeProvider = scopeProvider;
    }

    public IDisposable BeginScope<TState>(TState state)
        => _scopeProvider.Push(state);

    public bool IsEnabled(LogLevel logLevel) => true;

    public void Log<TState>(LogLevel logLevel, EventId eventId, TState state, Exception? exception, Func<TState, Exception?, string> formatter)
    {
        // TODO use your own logic
        var sb = new StringBuilder();
        _scopeProvider.ForEachScope((data, state) => { state.AppendLine(data?.ToString()); }, sb);
        sb.Append(_categoryName).Append(':').AppendLine(formatter(state, exception));
        Console.WriteLine(sb.ToString());
    }
}
C#
// Register the provider
builder.Logging.AddProvider(new CustomLoggerProvider());
##EventListener
An event listener represents the target for all events generated by event source implementations in the current application domain. When a new event listener is created, it is logically attached to all event sources in that application domain.
C#
class ActivityEventListener : EventListener
{
    protected override void OnEventSourceCreated(EventSource eventSource)
    {
        if (eventSource.Name == "Microsoft-Diagnostics-DiagnosticSource")
        {
            var args = new Dictionary<string, string?>
            {
                ["FilterAndPayloadSpecs"] = "[AS]*\r\n*"
            };
            EnableEvents(eventSource, EventLevel.LogAlways, EventKeywords.All, args);
        }
    }

    protected override void OnEventWritten(EventWrittenEventArgs eventData)
    {
        Console.WriteLine($"EventListener: {eventData.EventId}; {eventData.EventName}");
        // TODO use eventData.PayloadNames and eventData.Payload to get the data
    }
}
C#
class MetricsEventListener : EventListener
{
    protected override void OnEventSourceCreated(EventSource eventSource)
    {
        if (eventSource.Name == "System.Diagnostics.Metrics")
        {
            var args = new Dictionary<string, string?>
            {
                ["Metrics"] = "SampleMeter;MyOther2\\SpecificInstrument"
            };
            EnableEvents(eventSource, EventLevel.LogAlways, EventKeywords.All, args);
        }
    }

    protected override void OnEventWritten(EventWrittenEventArgs eventData)
    {
        if (eventData.EventName == "CounterRateValuePublished")
        {
            Console.WriteLine($"{eventData.EventId}; {eventData.EventName}; {eventData.Payload[6]}");
            // TODO use eventData.PayloadNames and eventData.Payload to get the data
        }
        else
        {
            Console.WriteLine($"{eventData.EventId}; {eventData.EventName}");
            // TODO use eventData.PayloadNames and eventData.Payload to get the data
        }
    }
}
C#
class LogsEventListener : EventListener
{
    protected override void OnEventSourceCreated(EventSource eventSource)
    {
        if (eventSource.Name == "Microsoft-Extensions-Logging")
        {
            var keywords = LoggingEventSource.Keywords.JsonMessage;
            var args = new Dictionary<string, string?> { ["FilterSpecs"] = "" };
            EnableEvents(eventSource, EventLevel.LogAlways, keywords, args);
        }
    }

    protected override void OnEventWritten(EventWrittenEventArgs eventData)
    {
        Console.WriteLine($"{eventData.EventId}; {eventData.EventName}; level: {eventData.Payload[0]}; Logger: {eventData.Payload[2]}; EventId: {eventData.Payload[3]}; EventName: {eventData.Payload[4]}; FormattedMessage: {eventData.Payload[5]}");
        // TODO use eventData.PayloadNames and eventData.Payload to get the data
    }
}
Finally, you can start the listeners by instantiating them in your application:
C#
// Start the listeners
using var activityListener = new ActivityEventListener();
using var metricsListener = new MetricsEventListener();
using var logsListener = new LogsEventListener();
#Accessing telemetry data outside the application (ETW)
##dotnet trace
dotnet trace allows capturing a trace from a running application using the diagnostics event pipe.
PowerShell
dotnet tool install --global dotnet-trace
dotnet trace collect --name SampleApp
The default options record performance data. However, it doesn't collect data from ActivitySource, metrics, and logging. You have to specify additional providers on the command line using --providers.
- Capture all ActivitySource:
PowerShell
dotnet trace collect --name SampleApp --providers="Microsoft-Diagnostics-DiagnosticSource:::FilterAndPayloadSpecs=[AS]*"
- Capture ActivitySource from
SampleActivitySource and MyOtherSource:
PowerShell
dotnet trace collect --name SampleApp --providers="Microsoft-Diagnostics-DiagnosticSource:::FilterAndPayloadSpecs=[AS]SampleActivitySource`n[AS]MyOtherSource"
- Capture metrics from a specific meter:
PowerShell
dotnet trace collect --name SampleApp --providers="System.Diagnostics.Metrics:::Metrics=SampleMeter"
- Capture metrics from a specific instrument:
PowerShell
dotnet trace collect --name SampleApp --providers="System.Diagnostics.Metrics:::Metrics=SampleMeter\SampleCounter"
- Capture logs with json data:
PowerShell
dotnet trace collect --name SampleApp --providers="Microsoft-Extensions-Logging:8::FilterSpecs="
- Capture logs with formatted messages:
PowerShell
dotnet trace collect --name SampleApp --providers="Microsoft-Extensions-Logging:4::FilterSpecs="
- Capture logs with raw messages:
PowerShell
dotnet trace collect --name SampleApp --providers="Microsoft-Extensions-Logging:2::FilterSpecs="
- Capture logs from specific providers with raw messages:
PowerShell
dotnet trace collect --name SampleApp --providers="Microsoft-Extensions-Logging:2::FilterSpecs=SampleApp*:Information;Microsoft*:Warning"
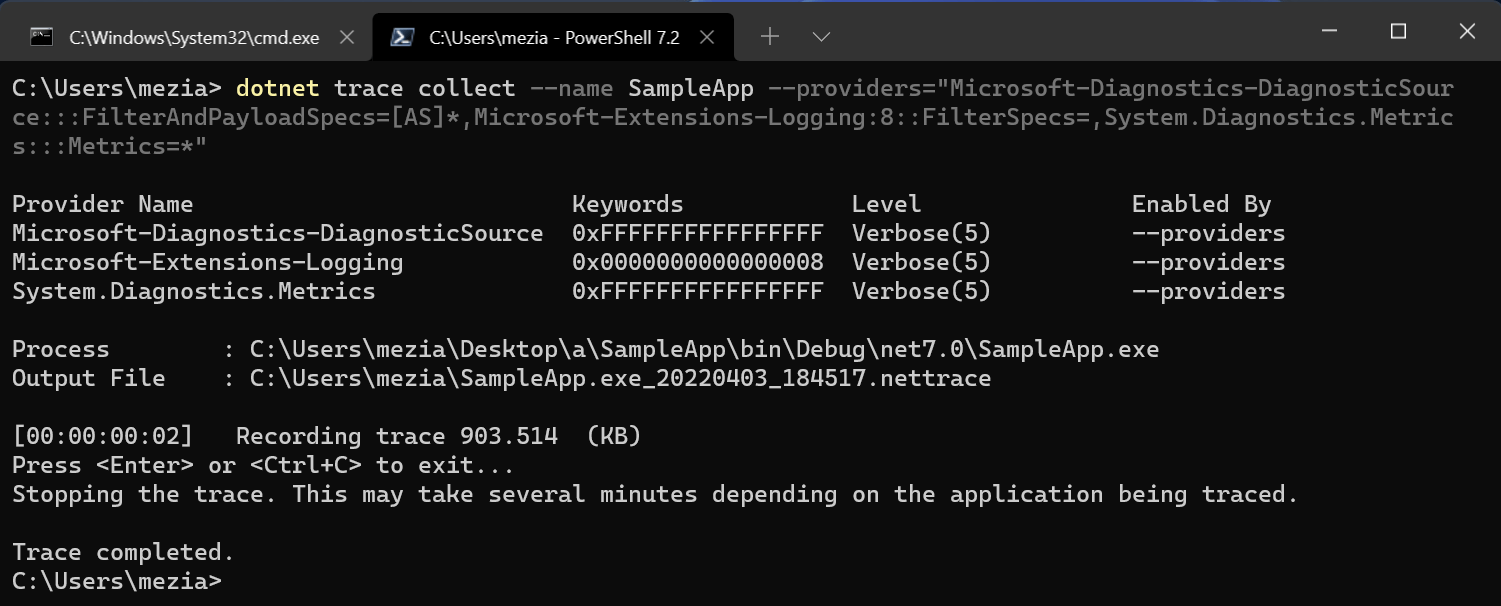
Finally, you can combine all providers in a single command:
PowerShell
dotnet trace collect --name SampleApp --providers="Microsoft-Diagnostics-DiagnosticSource:::FilterAndPayloadSpecs=[AS]*,Microsoft-Extensions-Logging:8::FilterSpecs=,System.Diagnostics.Metrics:::Metrics=SampleMeter"
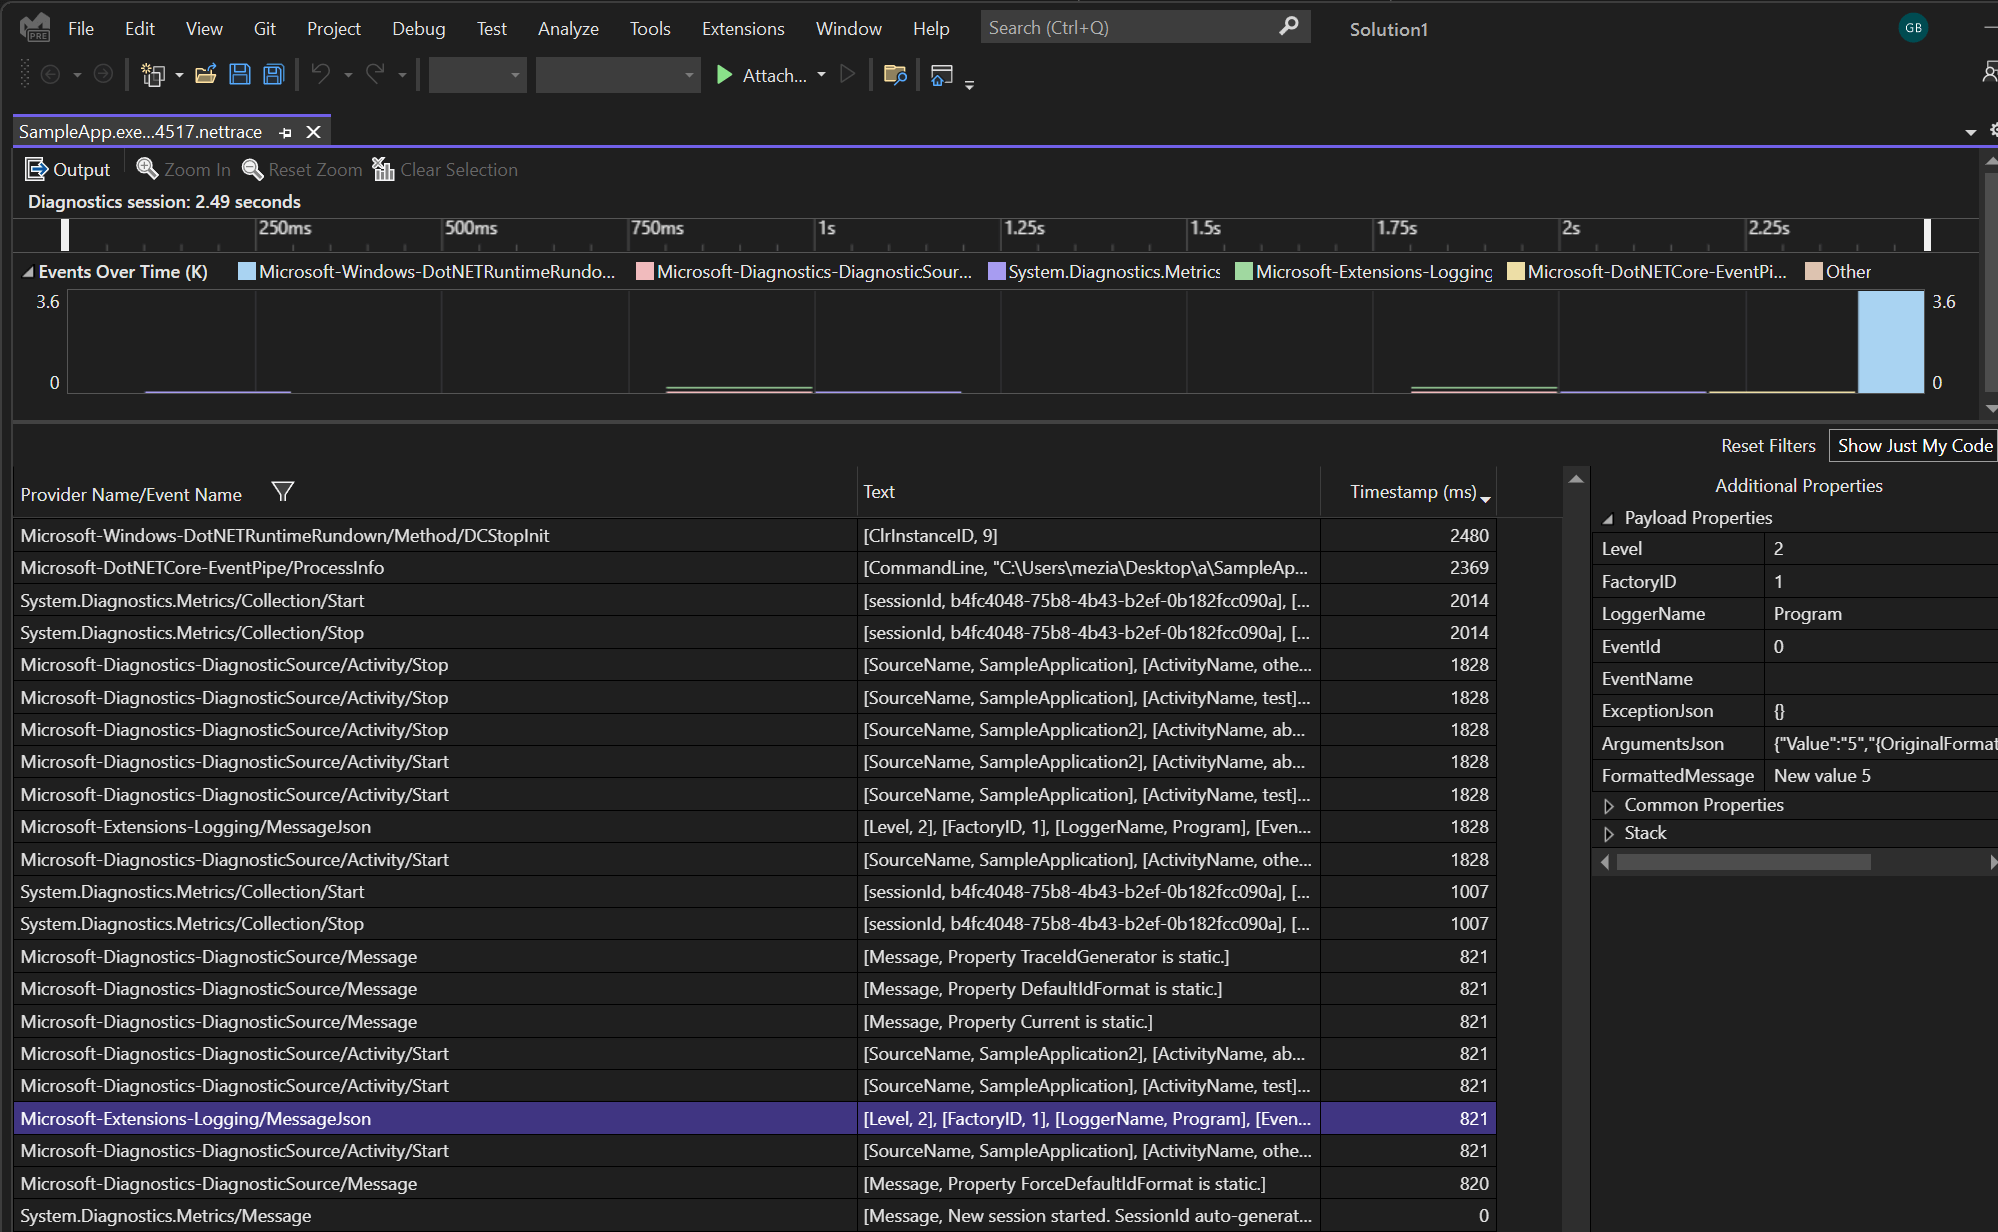
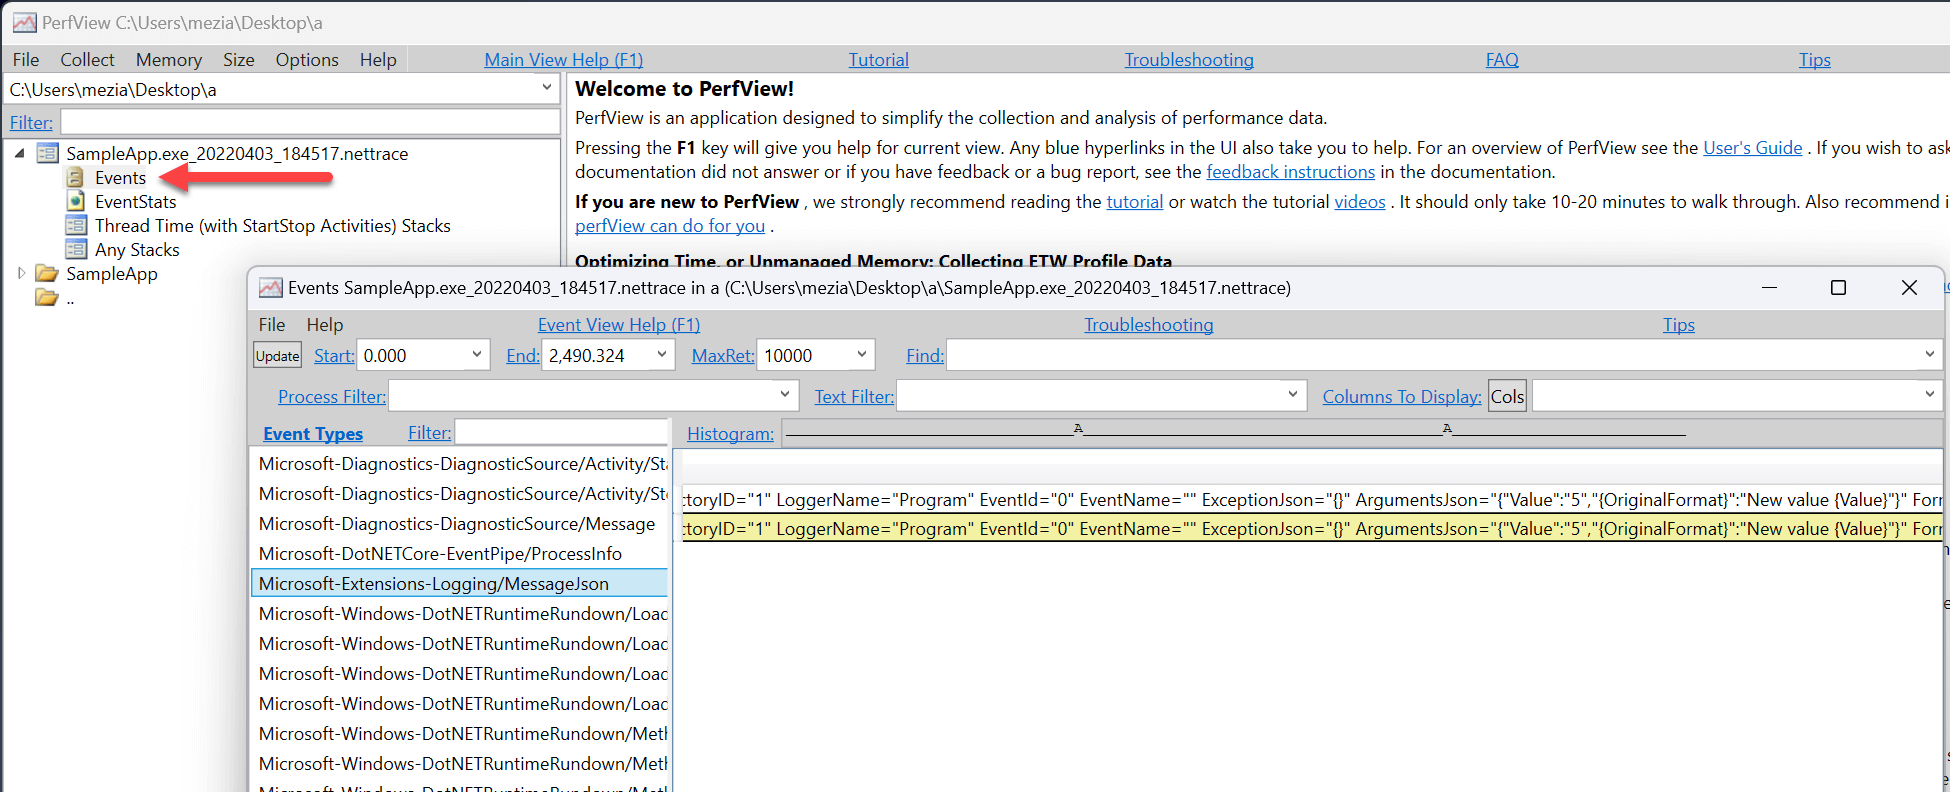
You can open the generated file using Visual Studio or PerfView:
##Diagnostic Event Pipe
You can diagnose a running .NET application using the diagnostics event pipe.
PowerShell
dotnet add package Microsoft.Diagnostics.NETCore.Client
dotnet add package Microsoft.Diagnostics.Tracing.TraceEvent
C#
using System.Diagnostics.Tracing;
using Microsoft.Diagnostics.NETCore.Client;
using Microsoft.Diagnostics.Tracing;

// TODO set the process id
int processId = 1234;

var providers = new List<EventPipeProvider>()
{
    new EventPipeProvider("Microsoft-Diagnostics-DiagnosticSource", EventLevel.Verbose, keywords: -1, arguments: new Dictionary<string, string>
    {
        ["FilterAndPayloadSpecs"] = "[AS]*",
    }),
    new EventPipeProvider("Microsoft-Extensions-Logging", EventLevel.Verbose, keywords: 8, arguments: new Dictionary<string, string>
    {
        ["FilterSpecs"] = "",
    }),
    new EventPipeProvider("System.Diagnostics.Metrics", EventLevel.Verbose, keywords: -1, arguments: new Dictionary<string, string>
    {
        ["Metrics"] = "SampleMeter",
    }),
};

var client = new DiagnosticsClient(processId);
using (EventPipeSession session = client.StartEventPipeSession(providers, requestRundown: false))
{
    var source = new EventPipeEventSource(session.EventStream);
    Task.Run(() =>
    {
        Console.WriteLine("Start listening");
        source.Process();
    });

    // TODO Use this callback to handle the events
    source.Dynamic.All += (TraceEvent obj) => Console.WriteLine(obj);

    await Task.Delay(5000); // Capture events for 5 seconds
    source.StopProcessing();
}
##Custom ETW session
You can subscribe to ETW events and process them in your own way. ETW allows to subscribe to events from any process running on the machine. First, you need to add the package Microsoft.Diagnostics.Tracing.TraceEvent to your project:
Shell
dotnet add package Microsoft.Diagnostics.Tracing.TraceEvent
Then, you can create a TraceEventSession and subscribe to the events you want to capture:
C#
var _etwSession = new TraceEventSession("MyEtwLog", @"c:\traces\log.etl");
_etwSession.EnableProvider(
    providerName: "Microsoft-Diagnostics-DiagnosticSource",
    providerLevel: Microsoft.Diagnostics.Tracing.TraceEventLevel.Always,
    options: new TraceEventProviderOptions()
    {
        Arguments = new[]
        {
            new KeyValuePair<string, string>("FilterAndPayloadSpecs", "[AS]*:Tags=*Activity.Tags.*Enumerate;Baggage=*Activity.Baggage.*Enumerate\r\n*"),
            // ProcessIDFilter = new[] { 123 },
        },
    });

_etwSession.EnableProvider(
    providerName: "System.Diagnostics.Metrics",
    providerLevel: Microsoft.Diagnostics.Tracing.TraceEventLevel.Always,
    options: new TraceEventProviderOptions()
    {
        Arguments = new[] { new KeyValuePair<string, string>("Metrics", "SampleMeter") },
        // ProcessIDFilter = new[] { 123 },
    });

_etwSession.EnableProvider(
    providerName: "Microsoft-Extensions-Logging",
    providerLevel: Microsoft.Diagnostics.Tracing.TraceEventLevel.Always,
    options: new TraceEventProviderOptions()
    {
        Arguments = new[] { new KeyValuePair<string, string>("FilterSpecs", "") },
        // ProcessIDFilter = new[] { 123 },
    });
You can open the etl file using PerfView or Visual Studio.
#Additional resources
Do you have a question or a suggestion about this post? Contact me!