The more code you write, the more bugs you create. Indeed, this is a known fact that almost all applications are buggy! This means that as a software developer, you must spend a part of your time debugging applications.
There are a few common steps when debugging an application:
- Getting all the needed information to understand the issue (reproduction steps, call stack, logs, etc.)
- Reproducing the problem and debugging the code
- Fixing the code
- Publishing the new version of the application
I think we should do more than just fix the specific problem. Here are a few questions you should ask yourself when fixing the bug. If you don't like the answers to these questions, then probably it is time to do something about your application or development environment 😉
#Was it easy to get all the information required to reproduce the bug?
- Which version of the application does the user run?
- What is the environment configuration? (Operating System, .NET version, current culture, screen resolution, RAM, CPU usage, etc.)
- What is the application configuration? (user settings, etc.)
- In case of a crash, do you have the call stack and is the error message clear?
- Do you have access to the logs?
- Are they easy to get and read?
- Are the log levels ok, so you can quickly find the most important messages?
- Do they provide enough information to understand what happened?
- Do they provide enough context? (current user, machine name, HTTP request context, etc.)
- In a multi-services application, are you able to see the flow? (Correlation Id)
- Do you have access to the telemetry data?
You can collect most of the information automatically using a solution such as Application Insights or any competitor. In the case of a desktop application, you may also consider creating a specific form for the user to report a problem. This form allows you to attach additional information to the user report. For example, Visual Studio has a dedicated page to report a problem. This form helps the user to write the problem description and automatically attach screenshots, logs, process dumps, etc. Microsoft Edge is also a great source of inspiration.
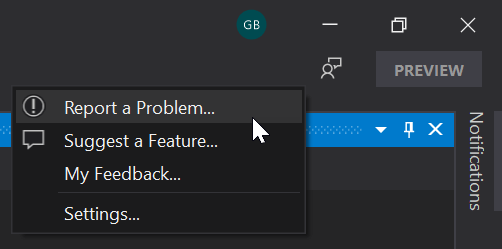
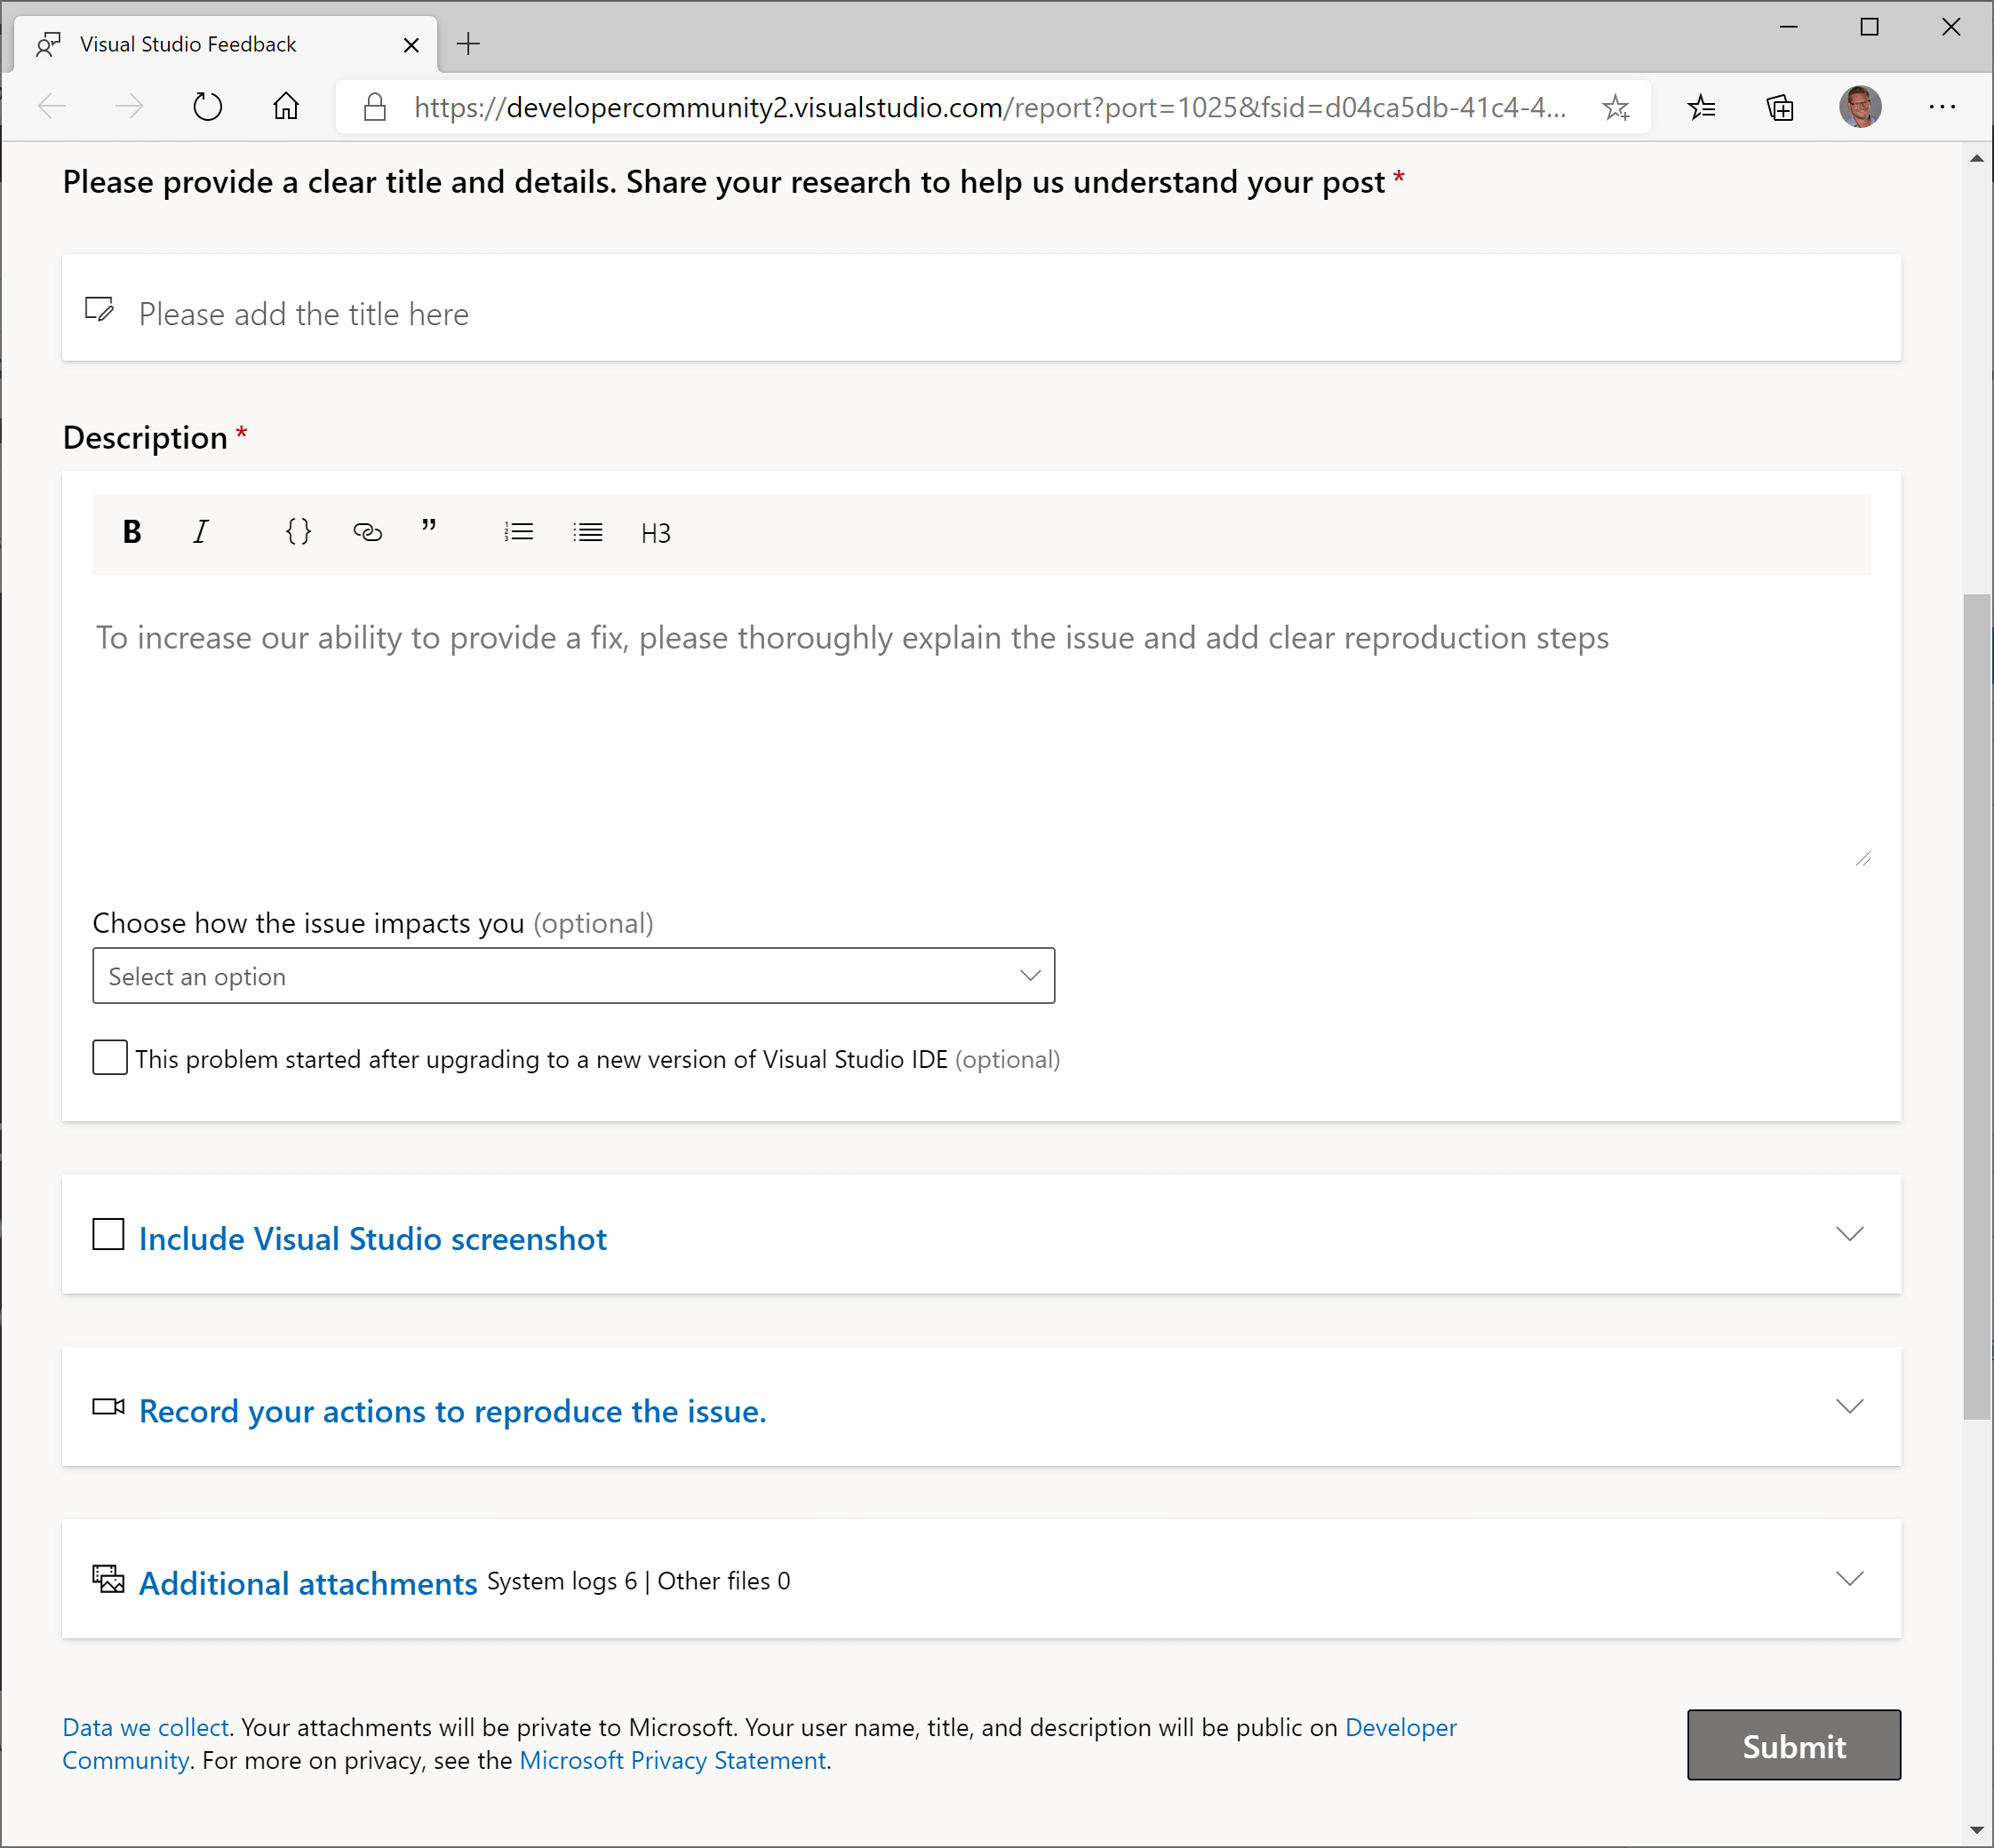 source: Overhauling the Visual Studio feedback system
At this stage, you should have a good idea of what the issue is without looking at the code.
#Was it easy to reproduce the issue in a development environment?
It is important to be able to reproduce the error in your development environment. It's what allows you to debug the application and find the bugs.
- Is it easy to start working on the project? (Get the code / Open the project in the IDE / Start debugging)
- Is the process documented correctly?
- Do you need to manually configure secrets to connect to external services?
- Does it require additional software configured on the machine? How do you get them?
- note: Dev Containers could be useful when applicable
- Is it easy to set up the same environment as the production (Azure Web App, Docker, Kubernetes)? Is it easy to debug this environment?
- Is it possible to get anonymized data from the production when needed to reproduce a specific bug?
- If you are not able to reproduce the problem on your dev environment, are you able to debug the staging/production or get a dump? For instance, using Azure, you can debug a live instance (Debug live ASP.NET Azure apps using the Snapshot Debugger). Be very careful when doing it to not block a live service by reaching a breakpoint, nor exposing sensible data…
#Was it easy to work on the codebase?
- Is the code well organized? Do you find what you are looking for?
- Is the code easy to read? Are the vocabulary, naming convention, and coding style the same across the project?
- Does it have obscure dependencies?
- How fast can you make code changes and see the resulting impact on your application?
- Can you take advantage of your IDE to debug the application?
- Are you able to use breakpoints and see local values or evaluate expressions?
- Do your types override
ToString or are decorated by the [DebuggerDisplay] attribute (Debugging your .NET application more easily), so you can quickly see the values while debugging? - etc.
#Why did the developer introduce this bug in the codebase?
In this step, you must find the reasons why a developer introduced the bug. Take a step back and analyze the problem.
- Is the project architecture correct?
- Is the code too complex?
- Methods are too long with too much complexity?
- Are you using the right tool to do the job?
- Are confusions possible? For instance, two types with the same name in different namespaces
- Are the prerequisites and post-condition of a method clearly explained? For instance,
- Is the documentation missing or not clear enough? Note that code comments explain the how and the why. They are useful to explain some non-trivial algorithms (how) and some decisions (why).
- Is changing a part of the application unexpectedly impact another part? (too tightly coupled)
- Are there enough tests? Is the testing strategy correct?
- Are the automated tests reliable?
- Do you have flaky tests?
- Do you have at least one end-to-end test for the main application scenario?
- Do the developers have enough training?
#How to prevent similar bugs in the codebase?
Solving the reported bug is a good start. Then, you must check if you can prevent developers from introducing similar bugs later in the code. There are multiple strategies depending on the kind of bug you are trying to prevent. Most of them involve using static analysis. Indeed, this is an automated way to detect issues before you push your code to the server. But it can also question your processes (code reviews, pair programming, etc.) or the project documentation.
 Source: CommitStrip - I'm watching you…
##Example 0: Training and knowledge sharing
Is there anything relating to this issue that needs sharing among the team? If so, you should organize a meeting to discuss it. This could be a good opportunity to share knowledge and improve the team's skills. You can also write a blog post or a documentation page to share the information with the team. This way, you can ensure that everyone is aware of the issue and knows how to avoid it in the future.
##Example 1: Code Reviews / pair programming
Code reviews can help to detect problems before the code goes to production:
- It ensures your code is understandable by another human
- Having another fresh pair of eyes looking at the code may detect problems
- An expert on the project may see impacts you haven't expected
- It is a good way to learn/teach things
Code review should not be about coding style, use automatic tools for that (linters, dotnet-format, StyleCop).
##Example 2: Compiler strictest options
The compiler should be your friend. A good friend tells you when you are doing something bad. By enabling the strictest compiler options you ensure the compiler doesn't allow code that misbehaves. Also, be sure to enable "Treat Warnings As Errors" at least in Release configuration, so the CI fails when the compiler reports a problem.
csproj (MSBuild project file)
<Project>
  <PropertyGroup>
    <Features>strict</Features>
    <AnalysisLevel>latest</AnalysisLevel> <!-- starting with .NET 5.0 -->
    <TreatWarningsAsErrors Condition="'$(Configuration)' != 'Debug'">true</TreatWarningsAsErrors>
  </PropertyGroup>
</Project>
The "Strict" feature detects problems such as wrong comparisons or casts to static classes:

I've already written a blog post on the C# compiler strict mode. This compiler option helps detecting bugs in the .NET CLR code or Roslyn.
##Example 3: Nullable Reference Types
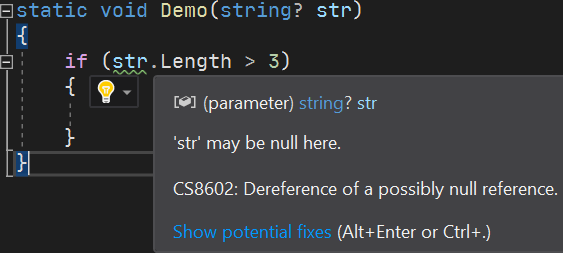
DrBrask has reported a NullReferenceException in a project I maintain. This kind of issue can be mitigated by using Nullable Reference Types. Enabling this compiler option helps me detect a few locations where a NullReferenceException could be raised in the project. It also documents the code by providing more information to the developer.
csproj (MSBuild project file)
<Project Sdk="Microsoft.NET.Sdk">
  <PropertyGroup>
    <OutputType>Exe</OutputType>
    <TargetFramework>net5.0</TargetFramework>
    <LangVersion>8.0</LangVersion>
    <Nullable>enable</Nullable>
  </PropertyGroup>
</Project>
##Example 4: Static analyzers / linters
Analyzers can detect patterns in the code and report them. If possible, you can fix the code automatically. If you detect wrong API usage in your code, you can create an analyzer to report it as soon as the developer writes the problematic code. For example, it's easy to forget to provide the StringComparison argument for string methods. This may lead to wrong comparisons or performance issues. An analyzer can detect these wrong usages and report them
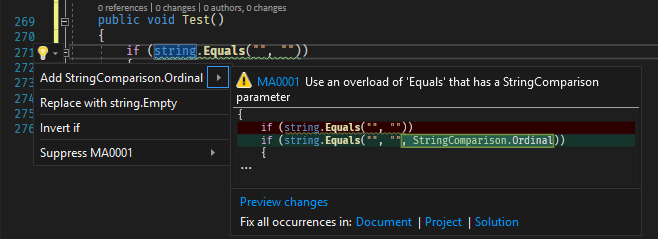
Here are the Roslyn analyzers I use in my projects:
##Example 5: Using the type system
It's common to use an int or Guid to represent an identifier. This means you may have lots of methods with a parameter of this data type in your code.
C#
class Database
{
    Customer LoadCustomerById(int customerId);
    Order LoadOrderById(int orderId);
    ...
}
In the code, you may use an order Id instead of a customer Id and the other way around. You can use a struct to encapsulate the id concept. This way you can take advantage of the type system to avoid mistakes.
C#
struct CustomerId { ... }
struct OrderId { ... }

class Database
{
    Customer LoadCustomerById(CustomerId customerId);
    Order LoadOrderById(OrderId orderId);
    ...
}
##Example 6: Prevent breaking changes
Breaking changes are easy to introduce. For instance, adding a new parameter with a default value is a breaking change. When you are developing a plugin system, breaking changes are not acceptable. There are multiple ways to deal with that kind of issue.
[BreakCop] is a tool that compares 2 assemblies and reports breaking changes. You can integrate this tool as a CI step to prevent publishing a new version with a breaking change. For instance, before publishing a new NuGet package, you can download the previous one and validate it against the new one using BreakCop.
Microsoft also provides an analyzer that helps in avoiding breaking changes. Microsoft.CodeAnalysis.PublicApiAnalyzers generates a file named PublicAPI.Shipped.txt that contains the list of public APIs. If you introduce a new API or remove an existing one, a warning indicates you must update the file. During code reviews, you can validate the public API is ok.
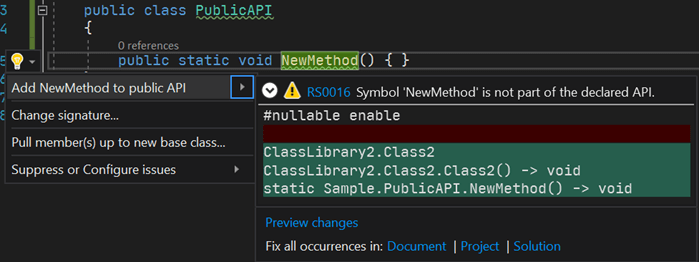
The .NET Framework project has another similar approach. They generate ref files that are valid C# files containing method definitions of public APIs (example). These files are generated during the compilation of the project. As with the analyzer, issues are detectable during code reviews.
##Example 7: Prevent usage of some types / methods (BannedAPIs analyzer)
In a project, we use a class from one of our internal libraries. A similar type with the same name also exists in the MongoDB library, but with different behavior. Using IntelliSense it's easy to import the wrong namespace and use the unwanted type. This is a very sneaky bug as the code looks good. Here's the fix for an issue we had in this project:

To prevent another developer from using the wrong type again, we added the BannedAPIs analyzer to the project. This allows configuring a list of forbidden types/methods in a project. When a banned symbol is used in the project, the compiler reports a warning and suggests another symbol to use.
You need to add a file named BannedSymbols.txt at the root of the project with the following content (documentation):
T:MongoDB.Driver.Core.Misc.SemanticVersion;Use NuGet.SemanticVersion instead
We are now sure that nobody uses the wrong type in the project.

##Example 8: Fuzz testing
Fuzzing or fuzz testing is an automated software testing technique that involves providing invalid, unexpected, or random data as inputs to a computer program
Wikipedia
In a project, we have the following interface with many classes that implement it:
C#
public interface IMessageParser
{
    Task<ParseResult> ParseAsync(string message);
}
It parses many kinds of strings. One of the implementations crashed when parsing unexpected values. After fixing the bug in the problematic implementation, we added a test that ensures every implementation can process special strings.
C#
[Fact]
public async Task MessageParser_should_not_crach(IMessageParser messageParser)
{
    // You can also generate random values or use specialized tools to smartly generate value
    var values = new [] { "", "42", "true", "false", "null", "\"a\"", "a", "{}", "{", "<root>", "{\"a\":null}" };

    var messageParserTypes = typeof(IMessageParser).Assembly.GetExportedTypes().Where(t => !t.IsAbstract && typeof(IMessageParser).IsAssignableFrom(t));
    foreach (var messageParserType in messageParserTypes)
    {
        var instance = (IMessageParser)ActivatorUtilities.CreateInstance(serviceProvider, messageParserType);
        foreach (var value in values)
        {
            // Ensure it does not raise an exception
            await messageParser.ParseMessage(value);
        }
    }
}
Do you have a question or a suggestion about this post? Contact me!