When an application misbehaves or hangs, generating a dump file is a valuable first step for debugging. There are several ways to do this on Windows, Linux, or Azure.
#Windows
##dotnet-dump (Windows)
The dotnet-dump global tool lets you collect and analyze dumps for .NET Core applications.
Install dotnet-dump (requires .NET SDK) or download it
Shell
dotnet tool install --global dotnet-dump
Find the process ID using the ps command
Shell
dotnet-dump ps
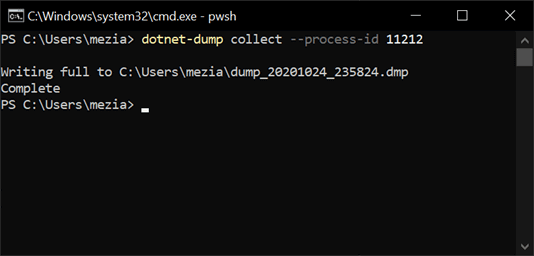
Generate a dump file for a specific process ID
Shell
dotnet-dump collect --process-id <ProcessId>
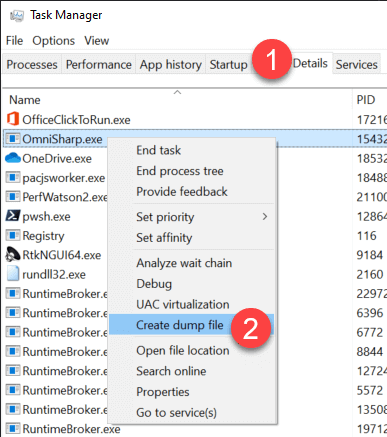
##Windows Task Manager
- Press Ctrl+Shift+Esc to open the Windows Task Manager
- Select the "Details" tab
- Find the application in the list
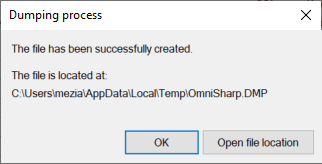
- Right-click and select "Create dump file"
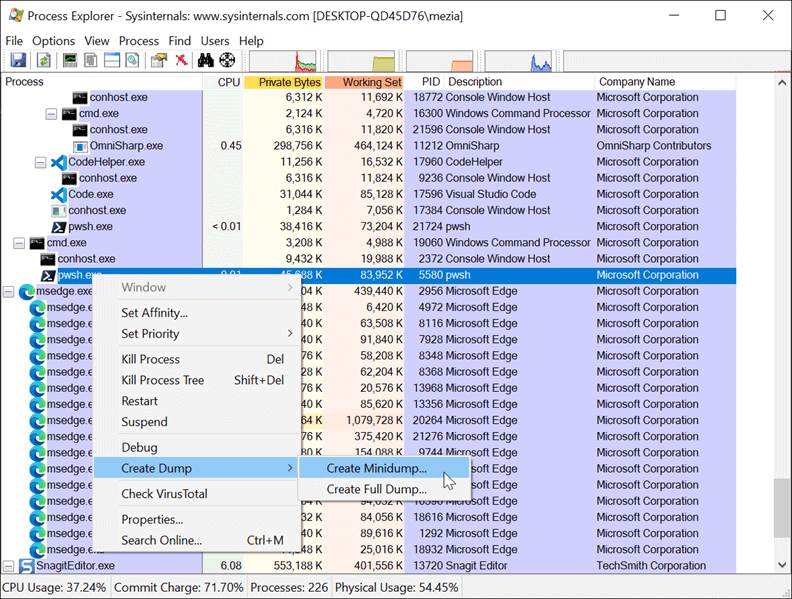
##SysInternals - Process Explorer
- Download Process Explorer: Process Explorer
- Open Process Explorer
- Right-click on the process and select the "Create Dump" menu item
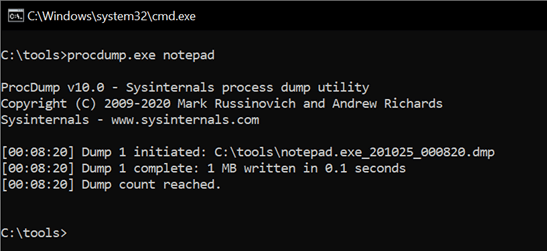
##SysInternals - ProcDump (Windows)
ProcDump is a command-line utility that can generate a dump file when the application freezes or when the process consumes too much CPU.
Download ProcDump: ProcDump
Generate a dump file using the process name or process id
procdump notepad
procdump 4572
You can generate a dump file when a specific exception is thrown:
Shell
procdump64.exe -e 1 -f IOException myapp.exe
-e 1 generates the dump when an exception is thrown, including first-chance exceptions-f IOException limits dump generation to when an IOException is thrown
##Debug Diagnostic Tool
Debug Diagnostic Tool can generate a dump file when a condition is met, such as when the application crashes or when CPU usage is high.
- Download Debug Diagnostic Tool v2 Update 3
- Start "DebugDiag 2 Collection" (available in the start menu)
- Configure a rule, such as when the application crashes
- When the condition is met, a crash dump is generated in the configured folder
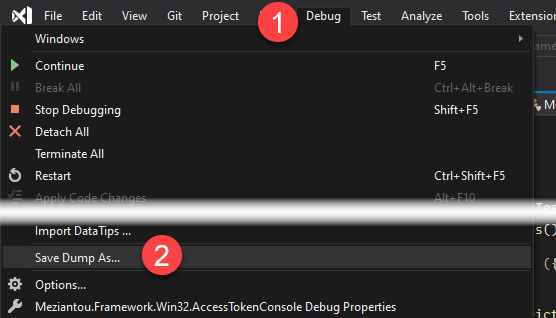
##Visual Studio
If you are debugging an application, you can save a dump file directly from Visual Studio. Open the "Debug" menu and click "Save Dump As…":
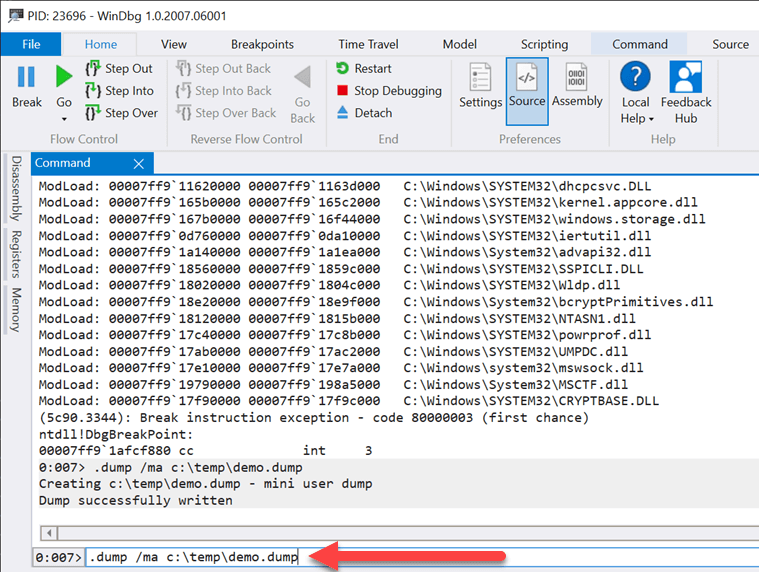
##WinDbg
If you are debugging an application using WinDbg, you can use the .dump command to generate a dump file. The /ma option generates a minidump with all memory for the attached process.
.dump /ma [path]
##Windows Error Reporting
Windows Error Reporting can generate a dump file when an application crashes. See my previous post for details: Automatically create a crash dump file on error
#Linux
##dotnet-dump (Linux)
The dotnet-dump global tool lets you collect and analyze dumps for .NET Core applications.
Install dotnet-dump (requires .NET SDK) or download it
Shell
dotnet tool install -g dotnet-dump
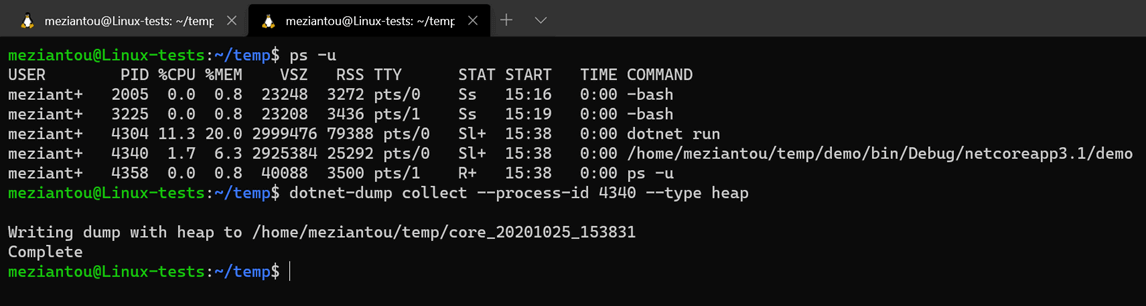
Find the process ID using bash or PowerShell
Shell
dotnet-dump ps
Generate a dump file for a specific process ID
Shell
dotnet-dump collect --type heap --process-id <ProcessId>
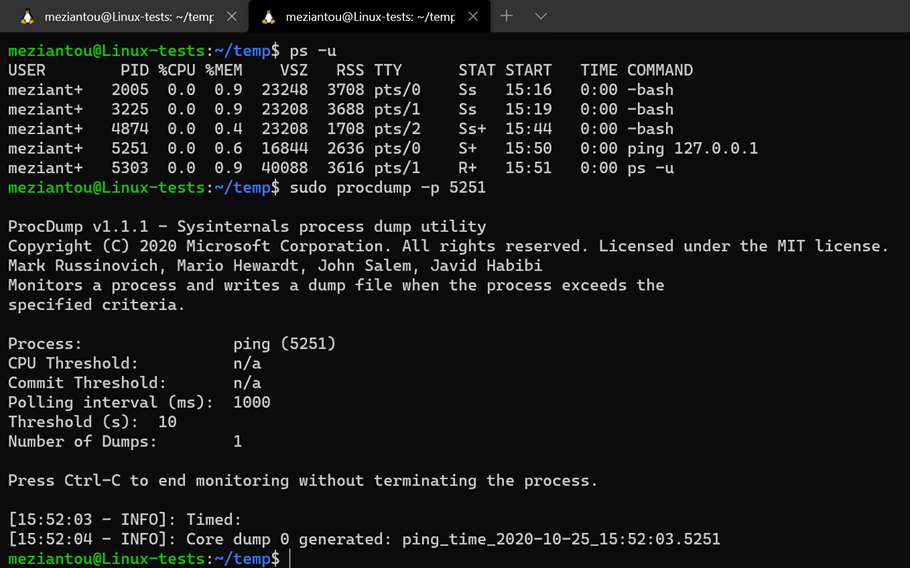
##SysInternals - ProcDump (Linux)
ProcDump is a command-line utility that can generate a dump file when the application freezes or when it consumes too much CPU.
Download ProcDump for Linux: ProcDump For Linux
Generate a dump file using the process name or process id
procdump 4572
#Azure App Services
Azure lets you generate and analyze dump files for App Services.
Select your App Service
Go to "Diagnose and solve problems"
Select Diagnose Tools
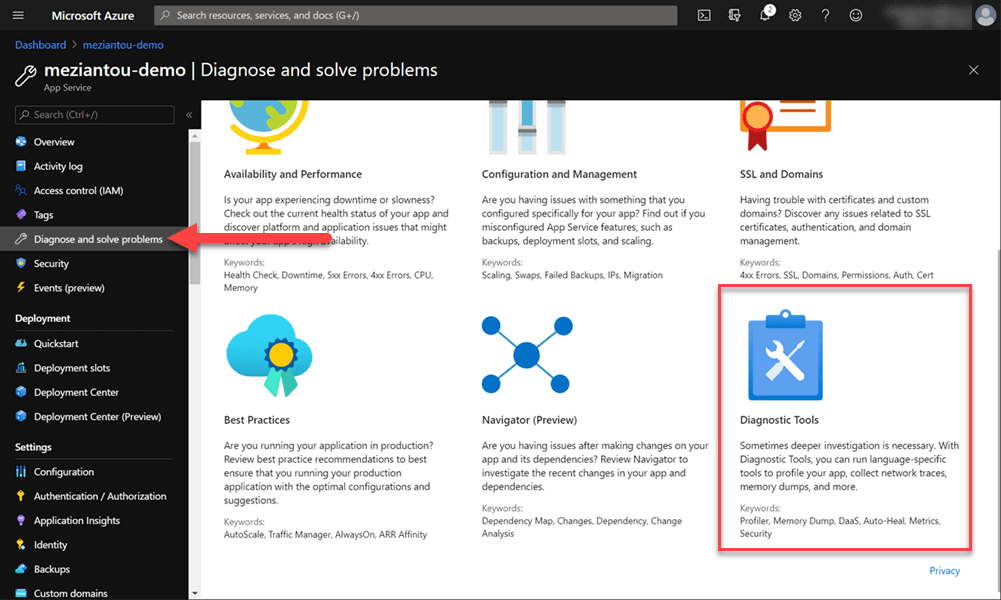
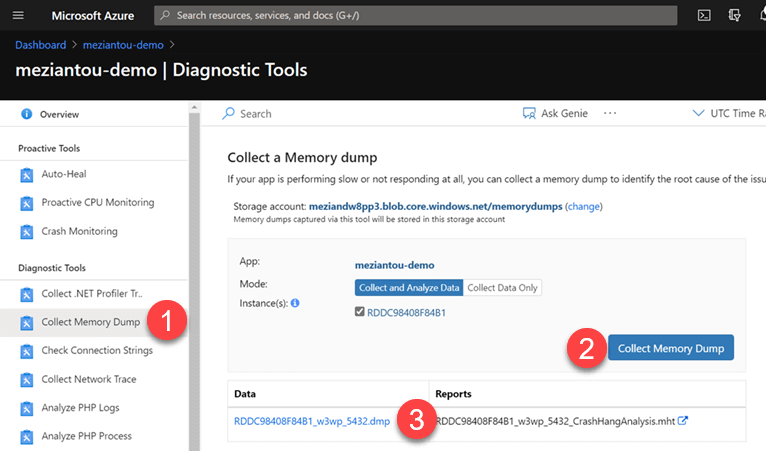
Select "Collect Memory Dump"
Click on the "Collect Memory Dump" button
After a few minutes, the dump is available in the configured storage account
Do you have a question or a suggestion about this post? Contact me!