A Roslyn source generator lets you programmatically generate C# or VB.NET source code at compile time. Source generators are implemented as Roslyn analyzers and distributed as NuGet packages. When you include one in your project, it runs during the build process and generates additional source code that is compiled together with the rest of your project.
Source generators are increasingly common. The .NET SDK includes several built-in generators, such as those for JSON serialization and optimized logging. Each generator adds time to both compilation and code editing in Visual Studio, so understanding their performance characteristics is key to avoiding bottlenecks in your projects.
This post covers two approaches to measuring source generator performance: the MSBuild binary log for build-time analysis, and ETW for live events while editing in Visual Studio.
#MSBuild - Binary Log
Roslyn can measure the execution time of each source generator. To enable this, add <ReportAnalyzer> to your project file:
csproj (MSBuild project file)
<Project Sdk="Microsoft.NET.Sdk">
  <PropertyGroup>
    <TargetFramework>net7.0</TargetFramework>
    <ReportAnalyzer>true</ReportAnalyzer>
  </PropertyGroup>
</Project>
Now, you can build using the binary log option:
Shell
dotnet build my_project.csproj /binaryLogger
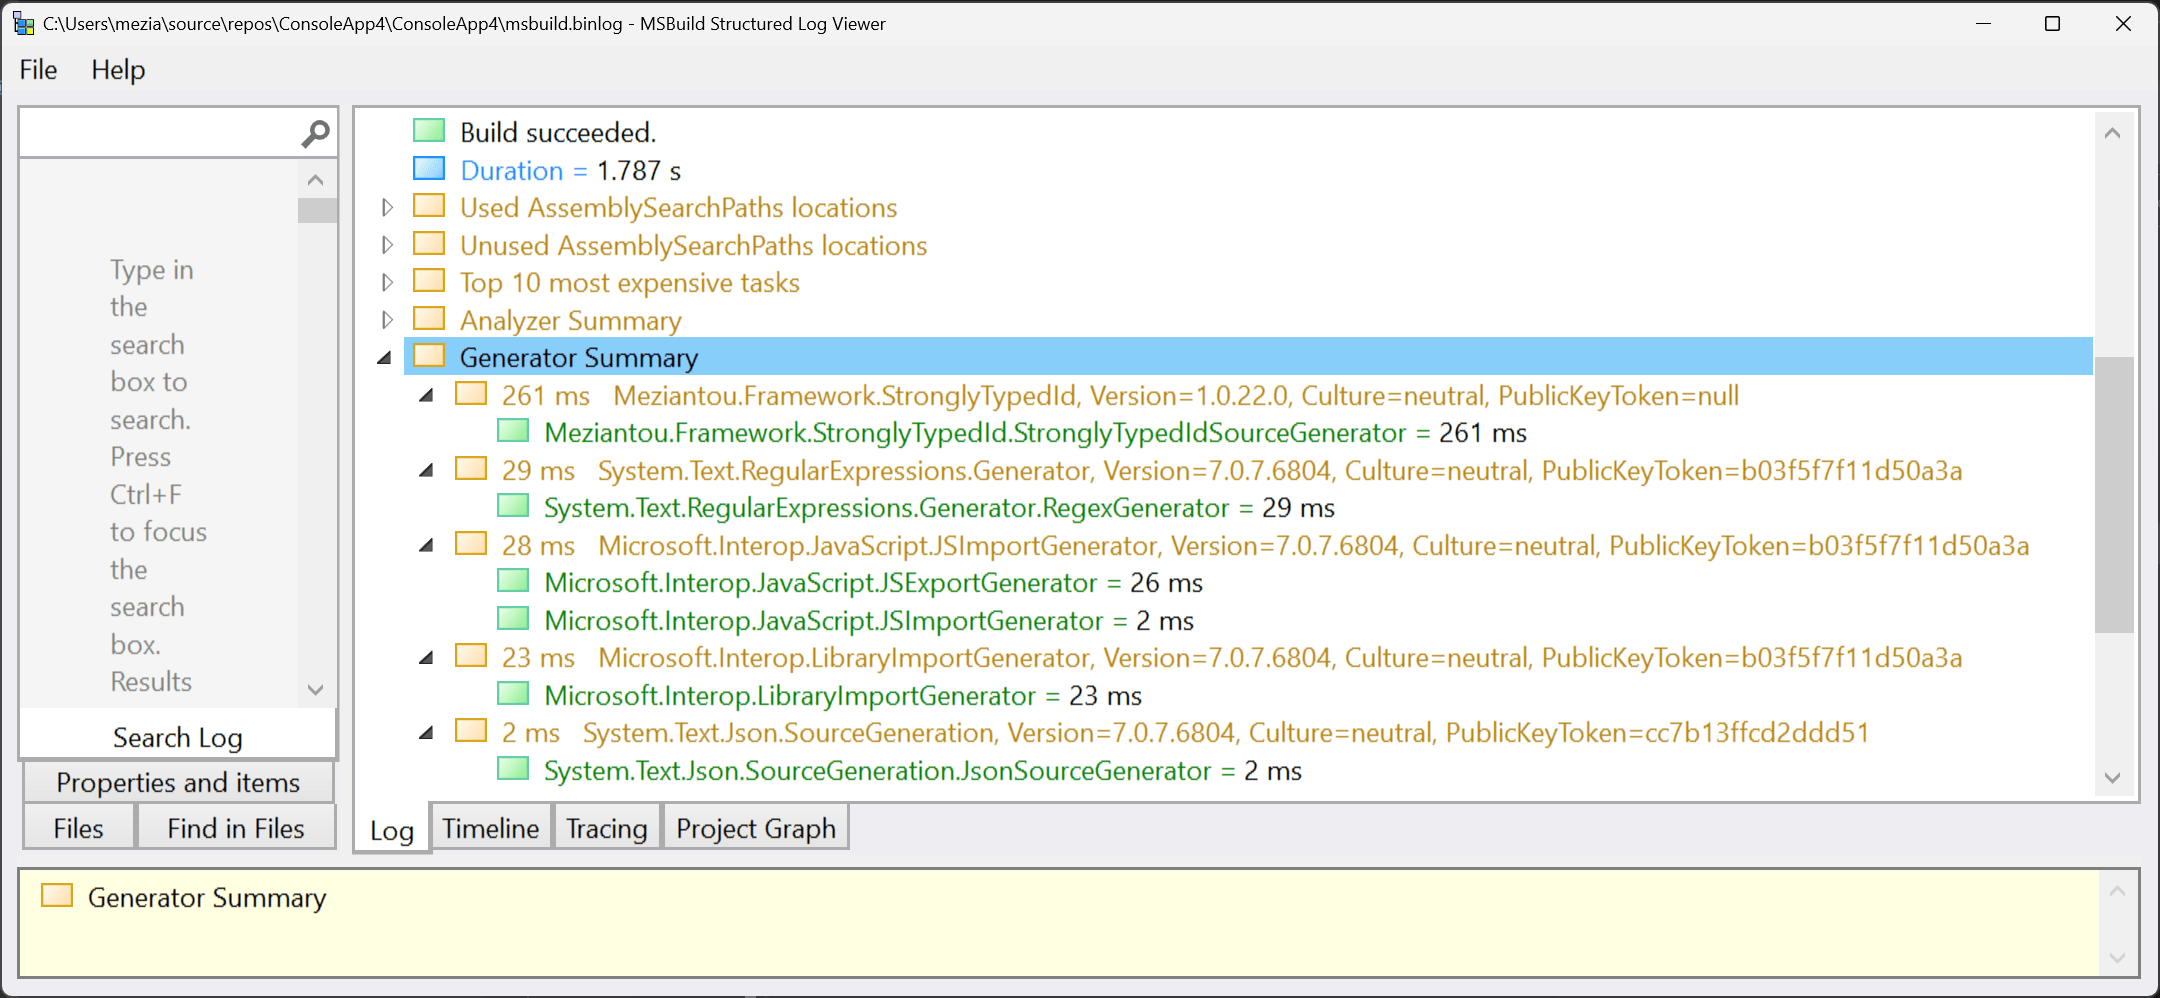
This creates an msbuild.binlog file containing the execution time of each source generator. Open it with the MSBuild Structured Log Viewer:
#Visual Studio - ETW
The binary log is a great tool for measuring source generator performance during builds, but it cannot capture what happens while editing code in Visual Studio. For that, you can use ETW to receive live events from Roslyn. There are multiple ways to listen to ETW events, including logman, PerfView, or a custom application. Here, I use a custom console application to display live events.
Shell
dotnet new console
dotnet add package Microsoft.Diagnostics.Tracing.TraceEvent
C#
using Microsoft.Diagnostics.Tracing.Session;

using var session = new TraceEventSession("roslyn-sg");
Console.CancelKeyPress += (_, _) => session.Dispose();

session.Source.Dynamic.AddCallbackForProviderEvent("Microsoft-CodeAnalysis-General", "SingleGeneratorRunTime/Stop", traceEvent =>
{
    var generatorName = (string)traceEvent.PayloadByName("generatorName");
    var ticks = (long)traceEvent.PayloadByName("elapsedTicks");
    //var id = (string)data.PayloadByName("id");
    //var assemblyPath = (string)data.PayloadByName("assemblyPath");

    Console.WriteLine($"{generatorName}: {TimeSpan.FromTicks(ticks).TotalMilliseconds:N0}ms");

    // As suggested by Lucas Trzesniewski (https://twitter.com/Lucas_Trz/status/1631739866915434497)
    // you can use Console.Beep() to get a sound when a source generator is executed.
    // If this is too noisy, you know one of the source generators doesn't use the cache correctly.
});

session.EnableProvider("Microsoft-CodeAnalysis-General");
session.Source.Process();
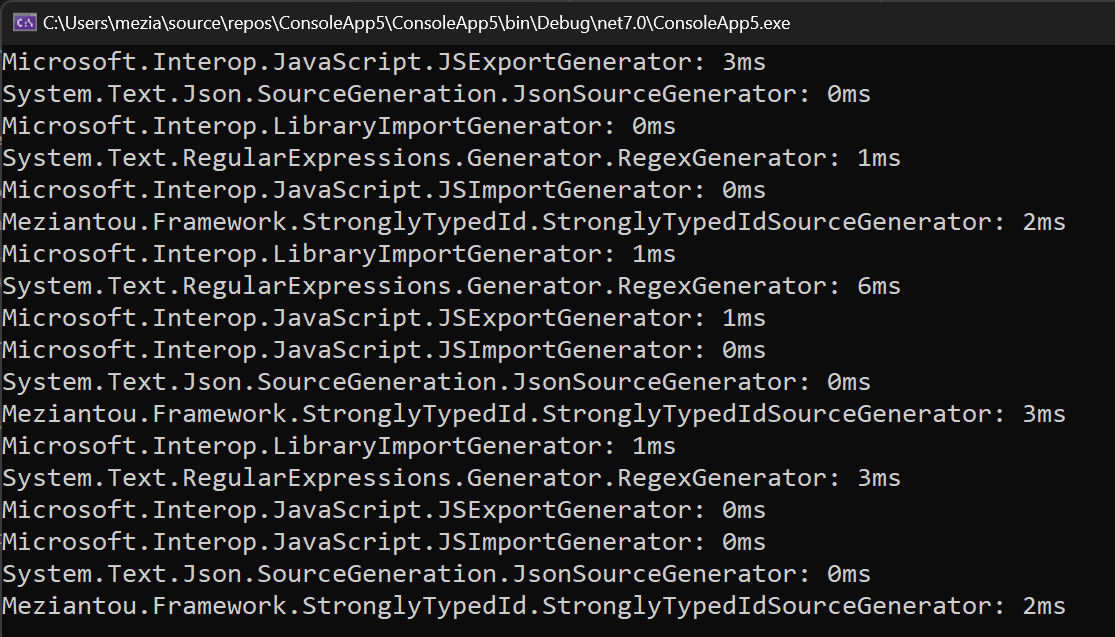
Run the application as an Administrator, then open Visual Studio. You will see the execution time of each source generator:
Do you have a question or a suggestion about this post? Contact me!