#What is OpenTelemetry?
OpenTelemetry is a set of APIs, SDKs, tooling and integrations that are designed for the creation and management of telemetry data such as traces, metrics, and logs. The project provides a vendor-agnostic implementation that can be configured to send telemetry data to the backends of your choice. It supports a variety of popular open-source projects including Jaeger and Prometheus. Also, a lot of vendors support OpenTelemetry directly or using the OpenTelemetry Collector.
OpenTelemetry allows monitoring multiple services (distributed system) and correlates their events. You can correlate events:
- By the time of execution. Each event records the moment of time or the range of time the execution took place. This is a basic way to correlate events.
- By the execution context. Each event has a TraceId and SpanId associated with it, so you can correlate logs and traces that correspond to the same ids. Also, you can propagate the ids between services using standard mechanisms such as the W3C tracecontext headers, so events from multiple services can be correlated.
- By the origin of the telemetry (resource context). It could be the service name, the service instance, or the service version.
OpenTelemetry defines 3 concepts when instrumenting an application:
#Code instrumentation
Instrumenting the code for OpenTelemetry in .NET is a bit unique. Instead, you don't need to use an OpenTelemetry library. Instead, you can use the types provided in System.Diagnostics and Microsoft.Extensions.Logging.Abstractions. This means that most of the .NET code that uses objects from these namespaces to instrument the code is already instrumented for OpenTelemetry. Also, there are lots of libraries that provide instrumentation for OpenTelemetry. You can use OpenTelemetry.Instrumentation.* packages to collect data from common sources:
This means you can use OpenTelemetry to monitor your application and get insights even if you don't manually instrument your application. That being said, you can still instrument your application manually if you want to.
##Logging
OpenTelemetry relies on Microsoft.Extensions.Logging.Abstractions to handle logging. This library provides a set of interfaces and classes that enable you to create logging services that can be used to log messages from your application. It supports structured logging, the arguments themselves are passed to the logging system, not just the formatted message template. This enables logging providers to store the parameter values as fields, which is useful to query your logs later. For example, using the following logger method, you could query all names containing a specific value requested within a specific time range.
C#
var builder = WebApplication.CreateBuilder(args);
var app = builder.Build();
app.MapGet("/", (ILogger<Program> logger, string name) =>
{
    logger.LogInformation("Hello {Name}! It is {Time}", name, DateTime.UtcNow);
    return Results.Ok($"Hello {name}");
});
app.Run();
##Tracing
OpenTelemetry relies on types in System.Diagnostics.* to support tracing. As those types have existed for a long time, this means that some parts of .NET and other libraries are already instrumented for OpenTelemetry. However, the naming is not the same as the one used by OpenTelemetry:
You can add some info to the activity using AddTag. These data will be exported so you can see them in the tool you use (Zipkin, Jaeger, Azure Monitor, etc.). For instance, when doing an http request, you can add the domain and the status code as tags. Then, in your monitoring tool, you can find which external services are not reliable enough.
You can also add baggage using AddBagage. Baggage will flow to child activities. This could be useful to flow a correlation id to all child activities, even the ones started on other services. Indeed, .NET sends baggage to other services automatically using W3C header (source).
C#
var activitySource = new ActivitySource("SampleActivitySource");

// ASP.NET Core starts an activity when handling a request
app.MapGet("/", async (string name) =>
{
    // The sampleActivity is automatically linked to the parent activity (the one from
    // ASP.NET Core in this case).
    // You can get the current activity using Activity.Current.
    using (var sampleActivity = activitySource.StartActivity("Sample", ActivityKind.Server))
    {
        // note that "sampleActivity" can be null here if nobody listen events generated
        // by the "SampleActivitySource" activity source.
        sampleActivity?.AddTag("Name", name);
        sampleActivity?.AddBaggage("SampleContext", name);

        // Simulate a long running operation
        await Task.Delay(1000);
    }

    return Results.Ok($"Hello {name}");
});
##Metrics
As for tracing, Metrics API is incorporated directly into the .NET runtime itself. So, you can instrument your application by simply depending on System.Diagnostics.*. .NET supports 4 kinds of metrics:
- Counter: Instrument that can be used to report monotonically increasing values. For example, you can increment the counter each time a request is processed to track the total number of requests. Most metric viewers display counters using a rate (requests/sec), by default, but can also display a cumulative total.
- ObservableCounter: Asynchronous instrument that reports monotonically increasing values. This is similar to a Counter, except the values are provided asynchronously.
- Histogram: Instrument that can be used to report arbitrary values that are likely to be statistically meaningful. It is intended for statistics such as histograms, summaries, and percentile.
- ObservableGauge: Asynchronous instrument that reports non-additive values when the instrument is being observed. An example of a non-additive value is the current number of tasks in an application.
C#
var meter = new Meter("MyApplication");

var counter = meter.CreateCounter<int>("Requests");
var histogram = meter.CreateHistogram<float>("RequestDuration", unit: "ms");
meter.CreateObservableGauge("ThreadCount", () => new[] { new Measurement<int>(ThreadPool.ThreadCount) });

var httpClient = new HttpClient();
app.MapGet("/", async (string name) =>
{
    // Measure the number of requests
    counter.Add(1, KeyValuePair.Create<string, object?>("name", name));

    var stopwatch = Stopwatch.StartNew();
    await httpClient.GetStringAsync("https://www.meziantou.net");

    // Measure the duration in ms of requests and includes the host in the tags
    histogram.Record(stopwatch.ElapsedMilliseconds,
        tag: KeyValuePair.Create<string, object?>("Host", "www.meziantou.net"));

    return Results.Ok($"Hello {name}");
});
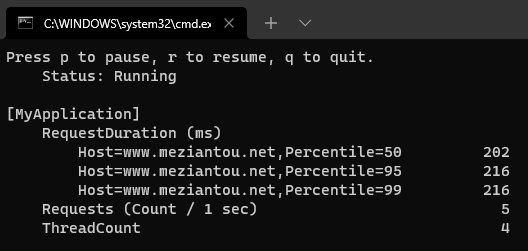
Using Meter also allows you to monitor the application using dotnet counters or dotnet monitor. You can install it using dotnet tool install --global dotnet-counters or direct download link. Then, you can use the following command to get the metrics:
Shell
dotnet tool install --global dotnet-counters
dotnet counters monitor --process-id 123 --counters MyApplication
#Exporting data
There are 2 ways to export data from OpenTelemetry:
The recommended way is to use the collector to export data. It makes your application back-end agnostic and provides a consistent way to export data for all your applications. It also simplifies the integration in applications as you only need to export data to the collector using a single protocol. No need to write a custom exporter for each back-end. Also, many vendors provide their exporters for the OpenTelemetry Collector. So, you can use them even if these vendors don't provide an exporter for .NET.
If you want to export directly to the backends without using the OpenTelemetry Collector, you can use the NuGet packages OpenTelemetry.Exporter.*.
There are multiple ways to deploy OpenTelemetry Collector. You can check the documentation for all details. In the following section, we'll use docker-compose to start the server and a few back-ends.
##Starting the collector and back-ends
The OpenTelemetry Collector is a generic service. You need to configure it to select how you want to receive, process and export data. The following example starts the collector and the back-ends. Also, it configures the collector to get data using the OpenTelemetry protocol and export data to Seq, Zipkin, Jaeger, Prometheus, and a file. Create the 3 following files in the same folder:
docker-compose.yaml
YAML
version: "2"
services:
  # back-ends
  # http://localhost:9411/zipkin
  zipkin-all-in-one:
    image: openzipkin/zipkin:latest
    ports:
      - "9411:9411"

  # http://localhost:16686/
  jaeger-all-in-one:
    image: jaegertracing/all-in-one:1.46
    environment:
      - COLLECTOR_OTLP_ENABLED=true
    ports:
      - "4318:4317"
      - "16686:16686"

  # http://localhost:9090/
  prometheus:
    container_name: prometheus
    image: prom/prometheus:latest
    volumes:
      - ./prometheus.yaml:/etc/prometheus/prometheus.yml
    ports:
      - "9090:9090"

  # http://localhost:5341/
  seq:
    container_name: seq
    image: datalust/seq:preview
    ports:
      - "5341:80"
      - "5342:5342"
      - "45341:45341"
    environment:
      - ACCEPT_EULA=Y

  # OpenTelemetry Collector
  otel-collector:
    image: otel/opentelemetry-collector:latest
    command: ["--config=/etc/otel-collector-config.yaml"]
    volumes:
      - ./otel-collector-config.yaml:/etc/otel-collector-config.yaml
      - ./output:/etc/output:rw # Store the logs
    ports:
      - "8888:8888"   # Prometheus metrics exposed by the collector
      - "8889:8889"   # Prometheus exporter metrics
      - "4317:4317"   # OTLP gRPC receiver
    depends_on:
      - zipkin-all-in-one
otel-collector-config.yaml
YAML
# Configure receivers
# We only need otlp protocol on grpc, but you can use http, zipkin, jaeger, aws, etc.
# https://github.com/open-telemetry/opentelemetry-collector-contrib/tree/main/receiver
receivers:
  otlp:
    protocols:
      grpc:
      http:

# Configure exporters
exporters:
  prometheus:
    endpoint: "0.0.0.0:8889"

  logging:

  zipkin:
    endpoint: "http://zipkin-all-in-one:9411/api/v2/spans"
    format: proto

  otlphttp/jaeger:
    endpoint: "http://jaeger-all-in-one:4318"
    tls:
      insecure: true

  otlphttp/seq:
    endpoint: "http://seq:5341/ingest/otlp"
    tls:
      insecure: true

  file:
    path: /etc/output/logs.json

# Configure processors (batch, sampling, filtering, hashing sensitive data, etc.)
# https://opentelemetry.io/docs/collector/configuration/#processors
processors:
  batch:

# Configure pipelines. Pipeline defines a path the data follows in the Collector
# starting from reception, then further processing or modification and finally
# exiting the Collector via exporters.
# https://opentelemetry.io/docs/collector/configuration/#service
# https://github.com/open-telemetry/opentelemetry-collector/blob/main/docs/design.md#pipelines
service:
  pipelines:
    traces:
      receivers: [otlp]
      processors: [batch]
      exporters: [logging, zipkin, otlphttp/jaeger]
    metrics:
      receivers: [otlp]
      processors: [batch]
      exporters: [logging, prometheus]
    logs:
      receivers: [otlp]
      processors: []
      exporters: [logging, file, otlphttp/seq]
prometheus.yaml
YAML
scrape_configs:
- job_name: 'otel-collector'
  scrape_interval: 10s
  static_configs:
  - targets: ['otel-collector:8889']
  - targets: ['otel-collector:8888']
After creating those 3 files, you can start the services using the following command:
Shell
docker-compose up
##Configuring the application to export data to the collector
To export data, you need to enable OpenTelemetry and configure which events to export.
First you need to add a few packages in your csproj:
csproj (MSBuild project file)
<Project Sdk="Microsoft.NET.Sdk.Web">

  <PropertyGroup>
    <TargetFramework>net6.0</TargetFramework>
    <Nullable>enable</Nullable>
    <ImplicitUsings>enable</ImplicitUsings>
  </PropertyGroup>

  <ItemGroup>
    <PackageReference Include="OpenTelemetry.Extensions.Hosting" Version="1.0.0-rc8" />
    <PackageReference Include="OpenTelemetry.Instrumentation.AspNetCore" Version="1.0.0-rc8" />
    <PackageReference Include="OpenTelemetry.Instrumentation.Http" Version="1.0.0-rc8" />
    <PackageReference Include="OpenTelemetry.Exporter.OpenTelemetryProtocol" Version="1.2.0-beta1" />
    <PackageReference Include="OpenTelemetry.Exporter.OpenTelemetryProtocol.Logs" Version="1.0.0-rc8" />
  </ItemGroup>

</Project>
Then, you need to add the OpenTelemetry listeners for logs, traces, and metrics:
C#
using System.Diagnostics.Metrics;
using System.Diagnostics;
using OpenTelemetry.Metrics;
using OpenTelemetry.Trace;
using OpenTelemetry;
using OpenTelemetry.Logs;

// This is required if the collector doesn't expose an https endpoint. By default, .NET
// only allows http2 (required for gRPC) to secure endpoints.
AppContext.SetSwitch("System.Net.Http.SocketsHttpHandler.Http2UnencryptedSupport", true);

var builder = WebApplication.CreateBuilder(args);

// Configure metrics
builder.Services.AddOpenTelemetryMetrics(builder =>
{
    builder.AddHttpClientInstrumentation();
    builder.AddAspNetCoreInstrumentation();
    builder.AddMeter("MyApplicationMetrics");
    builder.AddOtlpExporter(options => options.Endpoint = new Uri("http://localhost:4317"));
});

// Configure tracing
builder.Services.AddOpenTelemetryTracing(builder =>
{
    builder.AddHttpClientInstrumentation();
    builder.AddAspNetCoreInstrumentation();
    builder.AddEventCountersInstrumentation(c =>
    {
        // https://learn.microsoft.com/en-us/dotnet/core/diagnostics/available-counters?WT.mc_id=DT-MVP-5003978
        c.AddEventSources(
            "Microsoft.AspNetCore.Hosting",
            "System.Net.Http",
            "System.Net.Sockets",
            "System.Net.NameResolution",
            "System.Net.Security");
    });
    builder.AddSource("MyApplicationActivitySource");
    builder.AddOtlpExporter(options => options.Endpoint = new Uri("http://localhost:4317"));
});

// Configure logging
builder.Logging.AddOpenTelemetry(builder =>
{
    builder.IncludeFormattedMessage = true;
    builder.IncludeScopes = true;
    builder.ParseStateValues = true;
    builder.AddOtlpExporter(options => options.Endpoint = new Uri("http://localhost:4317"));
});

var app = builder.Build();

// Create a route (GET /) that will make an http call, increment a metric and log a trace
var activitySource = new ActivitySource("MyApplicationActivitySource");
var meter = new Meter("MyApplicationMetrics");
var requestCounter = meter.CreateCounter<int>("compute_requests");
var httpClient = new HttpClient();

// Routes are tracked by AddAspNetCoreInstrumentation
// note: You can add more data to the Activity by using HttpContext.Activity.SetTag("key", "value")
app.MapGet("/", async (ILogger<Program> logger) =>
{
    requestCounter.Add(1);

    using (var activity = activitySource.StartActivity("Get data"))
    {
        // Add data the the activity
        // You can see these data in Zipkin
        activity?.AddTag("sample", "value");

        // Http calls are tracked by AddHttpClientInstrumentation
        var str1 = await httpClient.GetStringAsync("https://example.com");
        var str2 = await httpClient.GetStringAsync("https://www.meziantou.net");

        logger.LogInformation("Response1 length: {Length}", str1.Length);
        logger.LogInformation("Response2 length: {Length}", str2.Length);
    }

    return Results.Ok();
});

app.Run();
If you start the application using dotnet run and refresh the page a few times, you will see the following:
Your application is now monitored 🙂
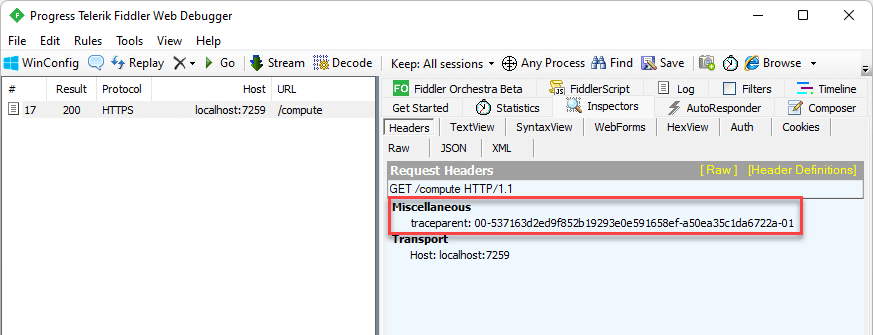
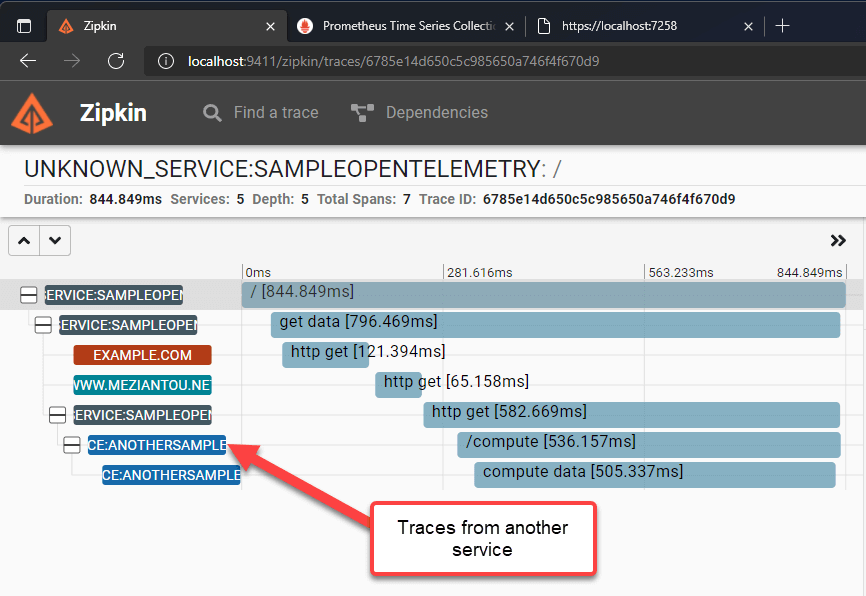
#Monitoring multiple services
When you have multiple services, they often interact with each other using REST or gRPC. To track a request from end to end, you can use a correlation Id. .NET automatically flows the current correlation id to the next service when using HttpClient (REST and gRPC) by using the traceparent header. This header is a W3C standard that allows tracing the request flow across services. This means that if you use the same back-end service to monitor all services, you can see the request flow across services:
You can customize the behavior of the HttpClient by using SocketsHttpHandler.ActivityHeadersPropagator:
C#
using var handler = new SocketsHttpHandler()
{
    ActivityHeadersPropagator = DistributedContextPropagator.CreateDefaultPropagator(),
};
using var client = new HttpClient(handler);
You can check the default implementation on GitHub: LegacyPropagator.cs
#Enriching the request activity created by ASP.NET Core
ASP.NET Core creates an activity for each request. You can enrich the activity by using the Activity.SetTag or Activity.SetBagage methods. To do so, you need to access the Activity instance. This instance is available using the IHttpActivityFeature feature:
C#
app.MapGet("/", (HttpContext context) =>
{
    var activity = context.Features.Get<IHttpActivityFeature>()?.Activity;
    activity?.SetTag("foo", "bar");

    return Results.Ok();
});
If you are not in a Controller or a Minimal API delegate, you can use the IHttpContextAccessor to get the HttpContext:
C#
public class MyService
{
    private readonly IHttpContextAccessor _httpContextAccessor;

    public MyService(IHttpContextAccessor httpContextAccessor)
    {
        _httpContextAccessor = httpContextAccessor;
    }

    public void DoSomething()
    {
        var context = _httpContextAccessor.HttpContext;
        var activity = context.Features.Get<IHttpActivityFeature>()?.Activity;
        activity?.SetTag("foo", "bar");
    }
}
#Additional resources
Do you have a question or a suggestion about this post? Contact me!