This post is part of the series 'Web Performance'. Be sure to check out the rest of the blog posts of the series!
- 💰 Better user experience means better conversion rate
Users don't like to wait. If your page takes too long to load, they may leave and go to another website. This is even more true on mobile, where connections are often slower than on desktop. Some studies show that 46% of users will not return to a poorly optimized site (source), and 53% of mobile site visits abandon a page that takes longer than three seconds to load (source)
A 2-second delay in load time during a transaction results in abandonment rates of up to 87%.
Case Study: How a 2-Second Improvement in Page Load Time More Than Doubled Conversions
- 💰 SEO (Search Engine Optimization)
Google has indicated that page speed is one of the criteria used by its algorithm to rank pages. Performance alone is unlikely to push your site to the top of results, but it may prevent it from dropping to the second page or worse.
In addition, a slow page speed means that search engines can crawl fewer pages using their allocated crawl budget, and this could negatively affect your indexation.
Optimizing your website can also reduce server resource usage, allowing the same server to handle more users and lowering hosting costs. This is especially true now that more services are hosted in the cloud, where you pay for what you use. The fewer resources you use, the less you pay.
If your website requires less CPU, less GPU, or less bandwidth, it consumes less energy and produces less heat. It is one way to help fight global warming! Note that reducing the ecological footprint of your website is possible on both the server side and the client side.
#What happens when a user navigates to your website?
When you access a web page such as https://www.meziantou.net, many steps are involved in rendering the page in your browser. Understanding these steps will help you find opportunities for improvement. Listing all of them would take more than one post, so here are the most important steps where performance improvements are possible:
- Query the DNS server to resolve the IP address from the domain name
- Initiate a TCP connection to the server
- Make an http GET request to the server
- The server processes the request and sends the response
- The browser checks if the response is a redirect or a conditional response (3xx result status codes), authorization request (401), error (4xx and 5xx), etc.; these are handled differently from normal responses (2xx)
- The browser decodes the response if encoded (gzip, brotli, etc.)
- The browser determines what to do with the response (e.g. is it a HTML page, an image, binary file, etc.?)
- The browser renders the response, or offers a download dialog for unrecognized types. If the response is an HTML file, rendering the page requires additional steps:
- Downloading resources such as images, CSS stylesheets, JavaScript files (DNS queries may be required for external domains)
- Parsing JavaScript and CSS files
- Executing JavaScript when needed
- Computing the layout of the page
- Rendering the page
This is just a quick overview. To go deeper, you can read these posts:
#Measure before doing changes
If you can not measure it, you can not improve it.
Peter Drucker
Before making optimizations, it is important to be able to measure the impact of your changes.
- Define the metrics you are interested in
- Decide what the kind of statistics you need: average, min, max, percentiles, etc.
- What are the goals for each metric?
- Measure the metric
Some common metrics you can track include:
- First Contentful Paint measures the time from navigation to the time when the browser renders the first bit of content from the DOM
- First Meaningful Paint is the paint after which the biggest above-the-fold layout change has happened
- The Time to Interactive measures how long it takes a page to become interactive
- The First CPU Idle measures when a page is minimally interactive
Measure these metrics under realistic load conditions. If you expect 1,000 concurrent users, measuring with a single user provides very little useful data.
Here are some tools you can use to measure these metrics:
##Microsoft Application Insights
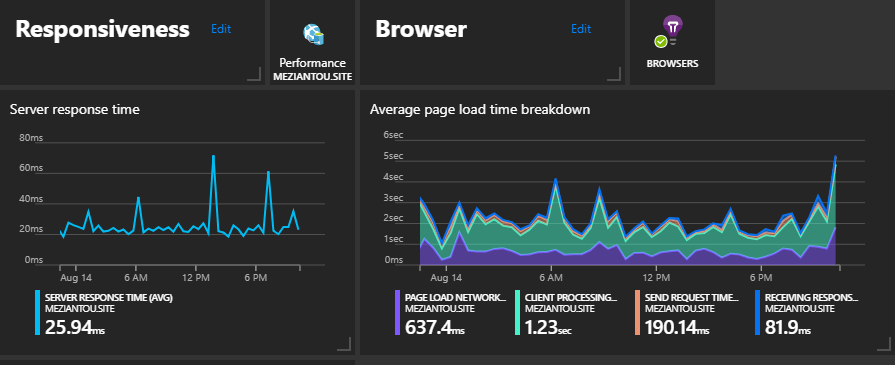
Application Insights shows page load times from your visitors. It allows you to measure the server-side and client-side performance. It also measures additional data such as CPU and memory usage or the number of visitors and requests. You can track custom measures. This could be useful to track the usage of some features or the time to execute a task.
There are some default graphs and queries, and you can create your own queries to measure your metrics. Also, you can create a custom dashboard with your KPI.
 Application Insights
##Google PageSpeed Insights
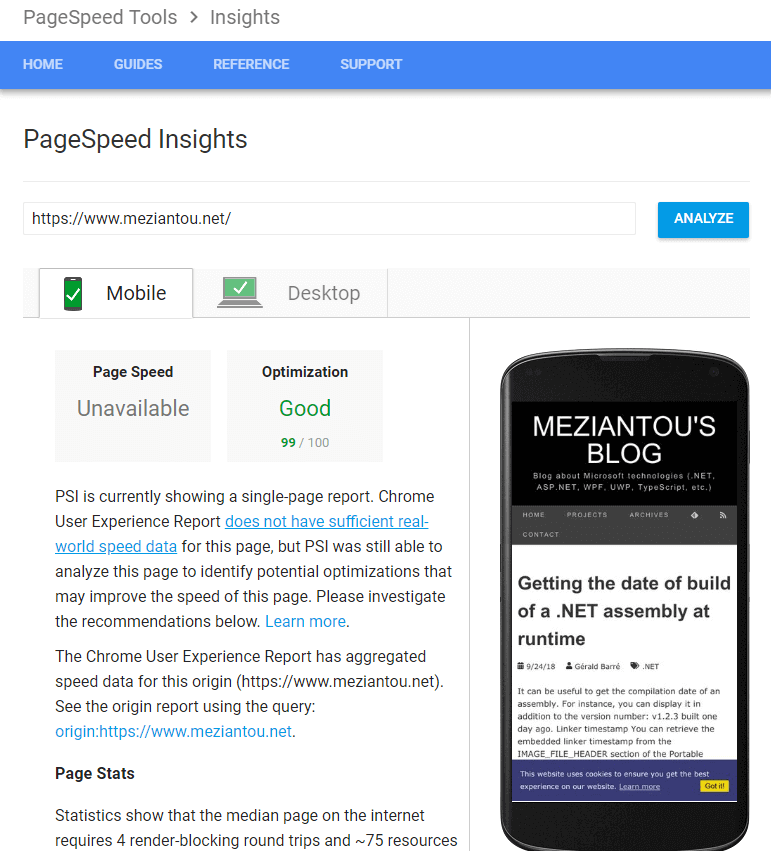
PageSpeed Insights reports on the real-world performance of a page for mobile and desktop devices and provides suggestions on how that page may be improved.
PageSpeed Insights checks about ten rules and provides documentation to fix all of them.
 Google PageSpeed report
##Lighthouse
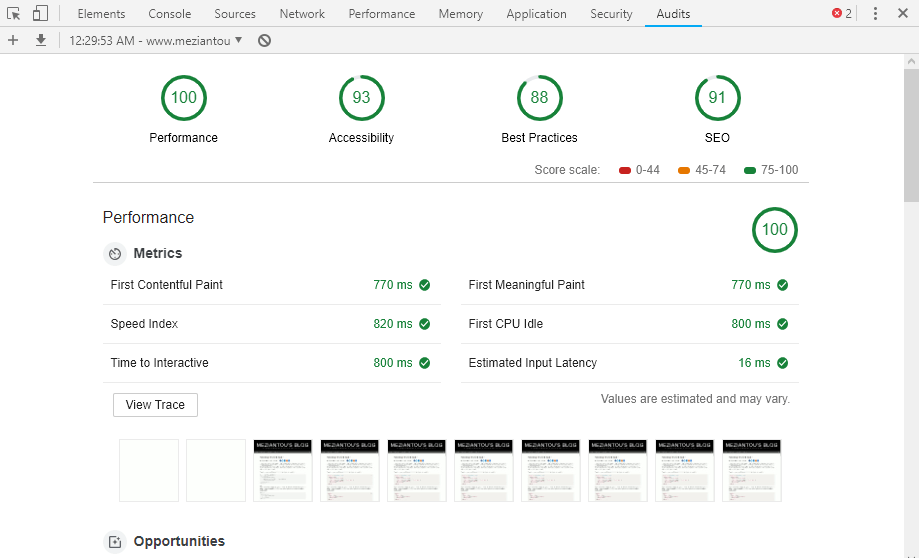
Lighthouse is an open-source, automated tool for improving the quality of web pages. You can run it against any web page, public, or requiring authentication. It has audits for performance, accessibility, progressive web apps, and more. Lighthouse is integrated into the Google Chrome Developer tools.
It is an excellent tool for a quick website audit, surfacing issues and guidance on how to fix them. One feature I particularly like is the screenshot timeline showing how the page looks at regular intervals during loading.
 Lighthouse
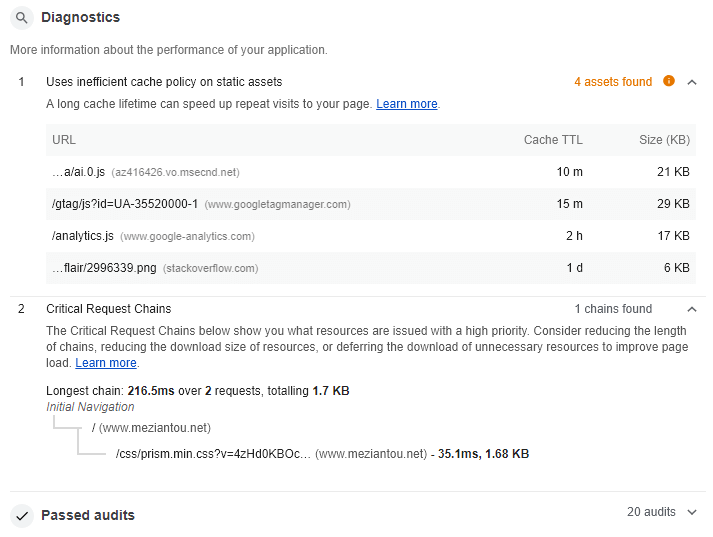 Lighthouse - Diagnostics
The developer tools in Google Chrome, Firefox, and Edge contain many useful tools. For performance, the Network, Performance, and Memory tabs are the most relevant.
The network tool allows you to view all the requests and their content. This is useful to check if all requests are useful. Thanks to the waterfall chart you can check if all resources are downloading in parallel or sequentially. You can also check which protocol is used and the size of the payload.
The performance tool allows you to check how your website behaves at runtime. Does your JavaScript block your website? Do you force the browser to compute the layout more than needed?
The memory tool helps detect memory leaks. This is less critical for static pages, but if you are building a Single Page Application (SPA), it is important to ensure your application does not leak memory, as it can become unstable after prolonged use. You can easily find detached DOM trees and check whether excessive garbage collection is occurring, which may indicate the need to reduce your application's memory pressure.
You can also simulate a slow network to see how your website performs under degraded conditions. For instance, simulating a slow 3G connection adds latency to all network calls. You can also throttle the CPU to see how your JavaScript behaves on slower devices. It is easy to forget that while you typically test on a fast computer, many of your users visit from mobile phones that are often considerably slower.
The audit panel allows you to see on one screen:
- The network calls
- Some metrics such as the First Paint (FP), the First Contentful Paint (FCP), the First Meaningful Paint (FMP), the DOMContentLoaded event, the Loaded event
- The blocking JavaScript
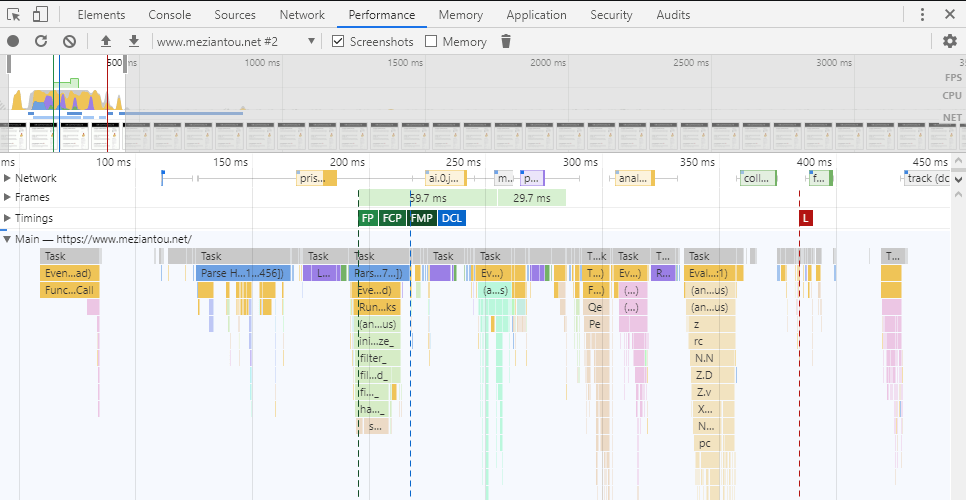 Chromium Developer Tools - Audit
The network tab allows you to see all the network calls, the size of the resources, the loading time, and when the download starts:
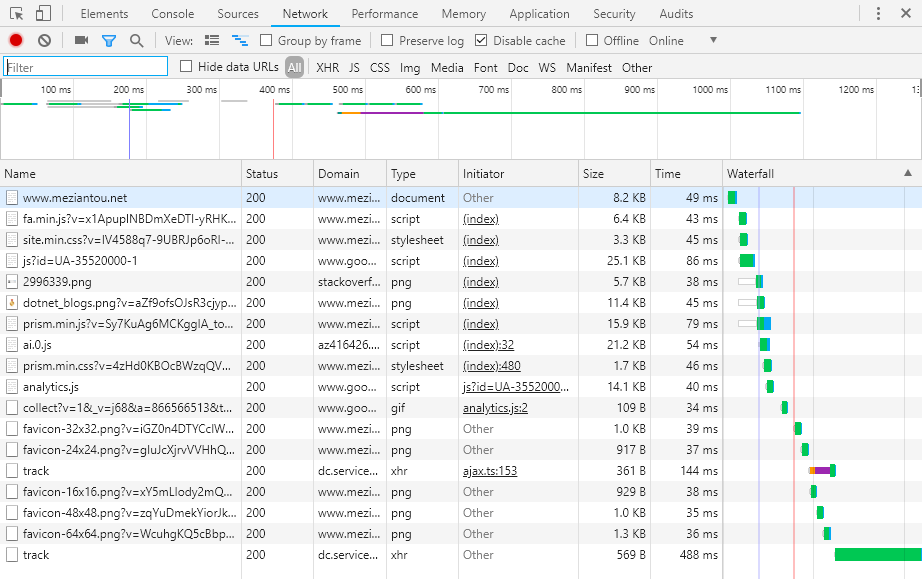 Chromium Developer Tools - Network panel
##Browser APIs
Browsers capture metrics and expose them through APIs. You can also use these APIs with JavaScript to diagnose performance issues. Here are some available APIs:
You can use the Navigation Timing API to gather performance data on the client-side. Also, the API lets you measure data that was previously difficult to obtain, such as the amount of time needed to unload the previous page, how long domain lookups take, the total time spent executing the window's load handler, and so forth.
The PerformanceResourceTiming interface enables retrieval and analysis of detailed network timing data regarding the loading of an application's resources. An application can use the timing metrics to determine, for example, the length of time it takes to fetch a specific resource, such as an XMLHttpRequest, image, or script.
The PerformancePaintTiming interface provides timing information about "paint" (also called "render") operations during web page construction. "Paint" refers to the conversion of the render tree to on-screen pixels.
You can use the PerformanceLongTaskTiming interface to identify tasks that block the UI or delay other tasks. To the user, this typically appears as a "locked up" page where the browser cannot respond to input – a major source of poor user experience on the web.
The ElementTiming API will allow developers to know when certain important image elements are first displayed on the screen. It will also enable analytics providers to measure the display time of images that take up a large fraction of the viewport when they first show up.
A web performance API that allows the developer to monitor the degree to which DOM elements have changed their on-screen position ("layout jank") during the user's session.
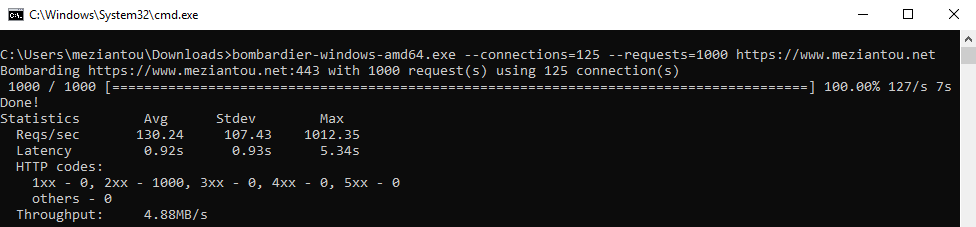
##Load testing using Bombardier
Bombardier is a free tool to measure the performance of your server by doing a load test. It works on Windows and Linux.
Shell
bombardier-windows-amd64.exe --connections=125 --requests=1000 https://www.meziantou.net
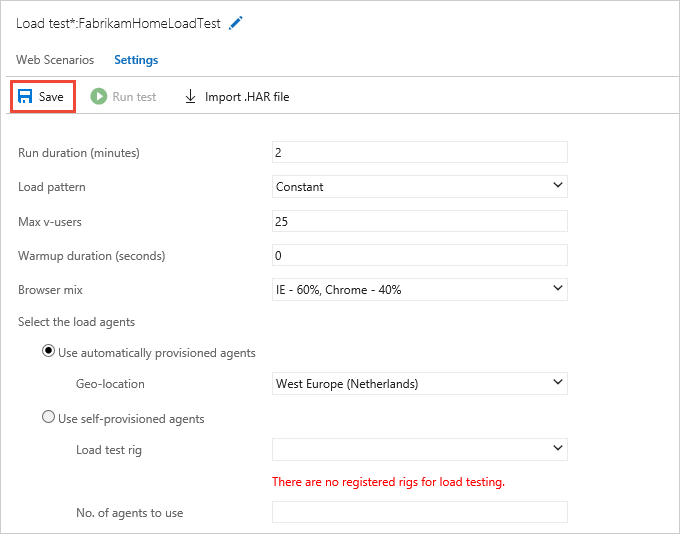
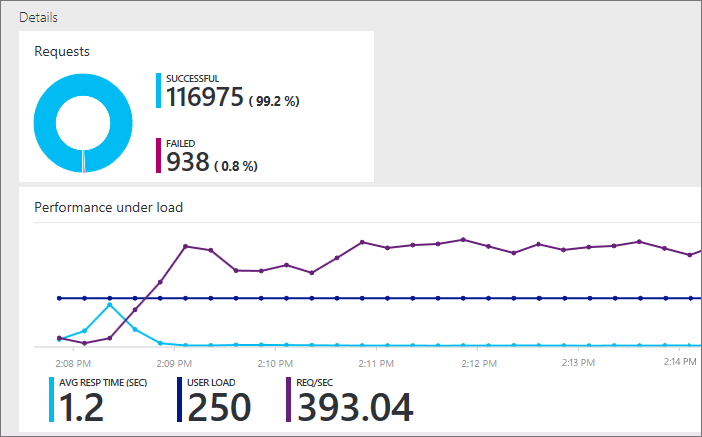
##Azure load testing
Microsoft Azure provides a load testing tool. This may be a better option than Bombardier because it offers many more configuration options. You can set a virtually unlimited number of virtual users, originating from multiple locations worldwide, with different browser profiles. You can also compare multiple runs.
Do you have a question or a suggestion about this post? Contact me!